Download
1 / 18
180 likes | 182 Views
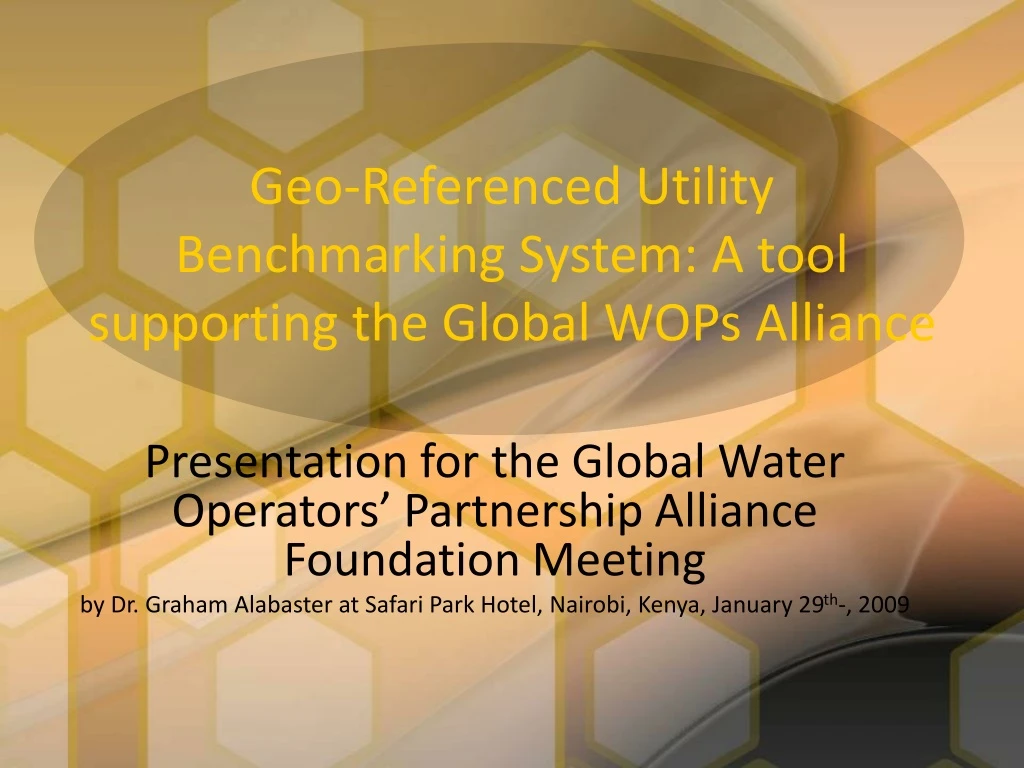
Geo-Referenced Utility Benchmarking System: A tool supporting the Global WOPs Alliance. Presentation for the Global Water Operators’ Partnership Alliance Foundation Meeting by Dr. Graham Alabaster at Safari Park Hotel, Nairobi, Kenya, January 29 th -, 2009. Input HH data.

E N D
Geo-Referenced Utility Benchmarking System: A tool supporting the Global WOPs Alliance Presentation for the Global Water Operators’ Partnership AllianceFoundation Meeting by Dr. Graham Alabaster at Safari Park Hotel, Nairobi, Kenya, January 29th-, 2009
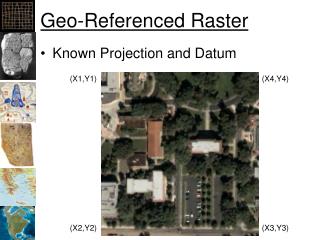
Input HH data UrbanInfo/Lake Victoria Info Monitoring/Policy Digitize Features from satellite images Digitize EA boundaries GIS System Field verification/ Quality Control maintainance the GIS and the database Integrating household data and geographic information
Total Population of Selected Secondary Urban Centres, Kenya 2006
Access to improved water source, Kenya 2006 (JMP data) Percentage
Access to improved water decreases dramatically when quantity is considered, Kenya 2006 (less than 20L/day)
Access to improved water decreases dramatically when quantity and cost are considered, Kenya 2006 (more than 10% of income)
Access to improved water decreases much further when quantity, cost, and the burden of fetching water are considered, Kenya 2006 (collection time >1 hr)
A c c e s s t o I m p r o v e d W a t e r M i g o r i , K e n y a A c c e s s t o I m p r o v e d W a t e r ( i n % ) 0 0 . 0 1 - 2 0 2 0 . 0 1 - 5 0 5 0 . 0 1 - 8 0 8 0 . 0 1 - 1 0 0
The h2.0 Inform and Empower Initiative Several attempts to improve current monitoring approaches but lack of good local, disaggregated data mask the true picture of what is happening on the ground. This project will therefore address three key themes: • Coverage data in addition to health, environment and socio-economic data, (based on UN-HABITAT Urban Inequities Survey) • benchmarking service providers - coverage and quality, but also accountability to customers • Development of citizen-based participatory monitoring techniques to support and empower communities • Use of GIS & Google products to compare/contrast data from different sources
Introduction to GRUBS Concurrent advancements in benchmarking, monitoring, GIS, and telecom technologies are multiplying the possibilities for new utility-centred analytical and problem solving applications. Some Potential Applications: • a geo-referenced utility benchmarking system (GRUBS) to track utility performance and to enable utilities to search and identify potential peer-support partners • a web-enabled, GIS-based databases of utility coverage areas that would enable water operators to understand and act upon variation in performance within their service areas & prepare utility mapping tools
GRUBS WorkshopNairobi, November 24h-25th, 2008 • UN-HABITAT, Google, IB-NET, h20 partners, utility representatives • Objectives: to understand how utilities use benchmarking and how GRUBS could add value • Outcome: UN-HABITAT Partnership with GWOPA, IB-Net and Google to develop a tool to address needs and new potentials.
Basic Concept The envisaged tool would give water service providers, regulators and consumers easily accessible and readily interpretable (mapped) information about WSPs customer responsiveness, particularly to the poor. The tool will show how WSPs are performing in different parts of their coverage area, and, secondarily, give an overall ‘rating’ for the utility as a whole.
The tool’s Key Functions would be to: • understand current WSP performance variability within a service area • highlight the location and “watsan realities” of the unserved population • help utilities and regulators develop appropriate pro-poor policies and planning strategies • allow better planning and evaluation of investment strategies • enable target setting to reduce pro-poor performance gaps – such as the basis for performance improvement contracts and staff incentive structures • help consumers to demand improved service and hold WSPs accountable • provide compelling data to attract funds and political support to improve service • highlight the potential market base among un-served areas of the city
The Key Users would be: • utilities • consumers • regulators • wops and utility associations
How the tool would work The tool would first bring together select sets of data from the following sources: • digitized utility network information(piped water and sewerage networks, connections) • household data (from national census, urban inequity surveys,) • customer feedback information, where available (ie. Citizen Report Carding) With these available datasets, the tool would use GIS to facilitate the calculation of aggregate indicators and analysis of customer responsive performance. For example, it might be programmed to answer: • which areas have the greatest unmet demand for services? • which areas suffer most from water-borne diseases? • which areas pay most for watsan services relative to income? • How does land tenure relate to water access? The (most relevant of) the analysed information would then be made available in a clear, readily understandable, interactive map formats and tables online, facilitated by Google
Why is such a tool relevant? • Currently, there is no simple way of understanding and demonstrating water and sanitation service inequities within urban areas. Statistics on access may exist, but are not commonly integrated with other socio-economic data to enable analysis of relationships. Furthermore, these statistics are rarely in a mapped format where spatial analysis can be conducted. Finally, such information does not exist in a format that is readily understandable to users and accessible to the public. • Being able to demonstrate spatial inequities in access to water and sanitation within urban areas is extremely important for creating the awareness, building the political support, and planning to improve the situation for the poor. The tool would aim to highlight the realities of the poor and underserved in urban areas that are normally hidden behind spatially-aggregated data. • The partnership with Google enables low-cost tools to be available event othe smallest utilities
Developing and Piloting the Tool • Development and testing of CRC and GRUBS in Lake Victoria (17 Towns) with exisitng UIS data • Zanzibar h20 pilot • Expressed interest by ZAWA, ONEP, Nairobi, NWSC of Uganda, Senegalaise des Eaux to pilot, but not limitied