Download
1 / 15
150 likes | 249 Views
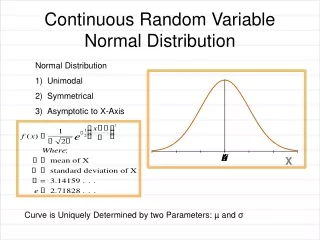
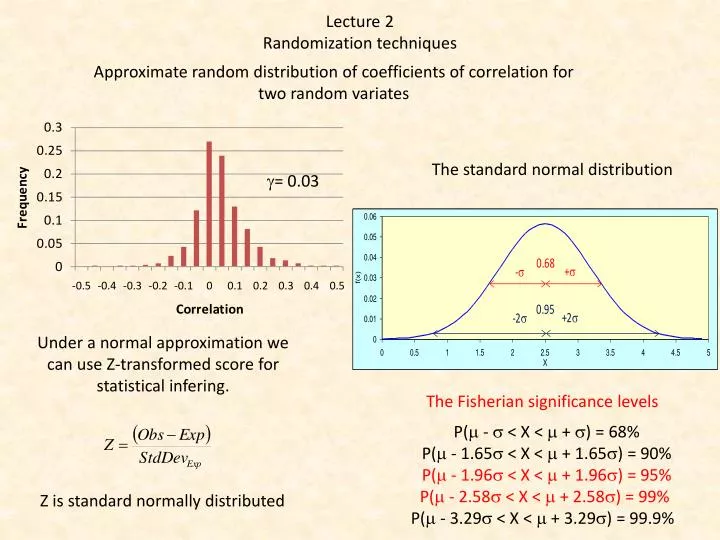
Lecture 2 Randomization techniques. Approximate random distribution of coefficients of correlation for two random variates. The standard normal distribution. g = 0.03. Under a normal approximation we can use Z-transformed score for statistical infering .

E N D
Lecture 2 Randomizationtechniques Approximate random distribution of coefficients of correlation for two random variates The standard normaldistribution g= 0.03 Under a normalapproximation we canuseZ-transformedscore for statisticalinfering. TheFisheriansignificancelevels P(m - s < X < m + s) = 68% P(m - 1.65s < X < m + 1.65s) = 90% P(m - 1.96s < X < m + 1.96s) = 95% P(m - 2.58s < X < m + 2.58s) = 99% P(m - 3.29s < X < m + 3.29s) = 99.9% Z is standard normallydistributed
AveragetemperaturedifferenceinEuropeancountries/islands Reshuffling Consider the coefficient of correlation. Statistical significance of r > 0 (H1) is tested against the null hypothesis H0 of r = 0. Most statistics programs do this using Fisher’s Z-transformation Parameters and standard errors Probabilitylevel Permutation test probability Bootstrapprobability
Permutationtesting We reorder one of thevariablesat random (at least 1000 times) We calculatethemean, standard deviation, and theupper and lowerconfidenceintervals. Thisgivesus an estimate of howprobableistheobservedcorrelation.
Thedistribution of randomizedcorrelationcoefficients Lower two-sided 1% confidence limit Upper two-sided 1% confidence limit Observedvalue Probabilitylevel for r = 0.457: P = 0.0006 Thedistributionis not symmetric. We can’tuseZ-transformedvalues (thenormalapproximation) We can’tuse a t-test. We have to usetheupper and lowerprobabilitylevels. We getthemdirectlyfromthe random distribution
Jackknifing Thejackknifed standard error of thecoefficient of variation
Bootstrapping Take theoriginalvalues and calculatetheparameteryouneed Take 1000 random samples of differentsize Calculate 1000 parametersfromthebootstrapsamples Comparetheobservedvaluewiththeparametersdistribution and calulatetheconfidencelimits for theobservedvalue
We useatleast 1000 random samples and calculate for eachsample CV. The standard deviation of thses CV valuesis an estimate of the standard error of theoriginal CV. The standard error of a distribution is identical to the standard deviation of the sample.
Bootstrapdistribution Themean CV valuesarebased on samples of differentsize. Thescoresaretherefore of differentvalue. We have to useweighedaverages
Nullmodels Do the beak length of Darwin finches as a measure of resource usage differ more or less than expected just by chance? Darwin finch Photo:Guardian Unlimited Theclassicalmethod to answerthisquestionis to comparetheobservedvarianceinbeaklengthdifferenceswiththoseobtainedfrom a random draw of beaklengthinsidetheobservedrange (smallest and largestbeaksizebeingfixed). Thisis a null model approach We test whether this null model approach is reliable
We haverandomlyassignedbeaklength of 20 speciesmeasuredin mm Randomizedvariances Observedvariance Thenulldistributiongivesusdirectlythe H0probability. P (H0) = 21/1000 = 0.021
Meningitisin Europe Distribution of forestsin Europe Istheprobability of Meningitisinfectioncorrelated to thedistribution of forestsin Europe? We usethecorefficient of correlationbetweentheentries of bothgrids R = 0.06; P(R=0) > 0.1. We use a gridaproach Thedistancebetweenthesitesmight be of importance.
Meningitisin Europe Distribution of forestsin Europe We reshufflerows and columnsonly to getthenull model distribution. P (H0) = 26/1000 = 0.026
Mantel test TheMantel test is a test for thecorrelationbetweentwodistancematrices. Ittestswhetherdistancesarecorrelated. Coefficient of correlationbetweenmatrixentries For convenience we useZ-transformed data