Download
1 / 23
230 likes | 417 Views
Marketing Value Analysis Example of Steps. Pricing and Product Strategy Course Dr. Jared Hansen UNC Charlotte. Value Analysis (Steps). 1. Research Purpose 2. Major Attributes Consumers Value 3. Attribute - Image, Functional Benefits, Emotional - Affective Benefits * Hierarchal Value Map

E N D
Marketing Value AnalysisExample of Steps Pricing and Product Strategy Course Dr. Jared Hansen UNC Charlotte
Value Analysis (Steps) 1. Research Purpose 2. Major Attributes Consumers Value 3. Attribute - Image, Functional Benefits, Emotional - Affective Benefits * Hierarchal Value Map 4. Brand Design Schematic 5. Person – Situation Segmentation Scheme 6. Importance – Performance and Gap Analysis 7. Marketing Strategy
2. Major Attributes Consumers Value • Focus Group (example) Quantitative laptop attributes valued are: • Price, Speed, Wireless, Battery Life, Weight, Screen Resolution/Size, Processor, RAM, Warrenty, Keyboards Ergonomics/Functions, Mouse Useability, Size, Memory/Storage, Programs, Video Cards. Qualitative laptop attributes valued are: • Reliability, Customization, Ease of Use, Functionality, Newest Capabilities,Tech Support, User Reviews. Salient attributes that drive the buying are (in no particular order): • Brand Reputation (A1), Price (A2), Customer Care (A3), Availability (A4), Warrenty (A5), Weight (A6), Battery Life (A7), Reliability (A8), and Design/Asthetics (A9).
3. Attribute - Image, Functional Benefits, Emotional - Affective Benefits • Value Questionnaires • Demographic & Usage Questions • Importance Scores • Semantic Differential Questions • Constant Sum Questions • Performance Scores • Focus Brand • Competing Brands
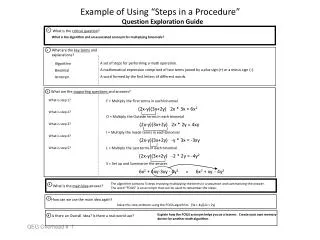
TERMINAL VALUES Accomplishment V7 Harmony V8 TERMINAL VALUES Maximize Potential V9 Self Confidence V1 INSTRUMENTAL VALUES INSTRUMENTAL VALUES Balanced Life V2 Better Person V3 Independence V5 Smart V6 Peace of Mind V4 PSYCHOSOCIAL CONSEQUENCES PSYCHOSOCIAL CONSEQUENCES Family Time C22 Organized C21 Money Making C20 Less Worry C17 Control of life C18 Self Image C15 Frugal C19 More Efficient C16 Control of budget C14 Use More Often C8 Dependable C13 Social Status C7 Less Down Time C9 Less Debt C11 Save More Money C12 Get More Done C2 More Portable C3 Les Risk C10 Techno Savvy C1 FUNCTIONAL CONSEQUENCES FUNCTIONAL CONSEQUENCES Better Value C6 Less Break-down C4 More Trust C5 ATTRIBUTES ATTRIBUTES Customer Service AA3 Cool Design AA1 (Low) Price AC7 Brand Reputation AA4 Speed AC2 Weight AC3 Reliability AA2 Battery Life AC4 Functionality AC1 Warranty AC5 Availability AC6 3. cont…Hierarchical Values Map
TERMINAL VALUES Accomplishment V7 TERMINAL VALUES Maximize Potential V9 Harmony V8 Self Confidence V1 Balanced Life V2 INSTRUMENTAL VALUES INSTRUMENTAL VALUES Better Person V3 Peace of Mind V4 Independence V5 Smart V6 PSYCHOSOCIAL CONSEQUENCES PSYCHOSOCIAL CONSEQUENCES Family Time C22 Money Making C20 Organized C21 Less Worry C17 control of life C18 Self Image C15 Frugal C19 More Efficient C16 control of budget C14 Use More Often C8 Dependable C13 Social Status C7 Less Down Time C9 Less Debt C11 Save More Money C12 Get More Done C2 More Portable C3 Techno Savvy C1 Less Risk C10 FUNCTIONAL CONSEQUENCES FUNCTIONAL CONSEQUENCES Better Value C6 Less Break-down C4 More Trust C5 ATTRIBUTES Cool Design AA1 ATTRIBUTES Reliability AA2 Battery Life AC4 Customer Service AA3 Brand Reputation AA4 Functionality AC1 Speed AC2 Weight AC3 Warranty AC5 Availability AC6 (Low) Price AC7 Importance 70% 59% 70% 69% 87% 75% 70% 77% 66% 71% 77% Cluster 1 2 2 2 2 2 1 1 1 1 3 3. cont…Linkage Breakage Map
Verbal Visual Brand Expression Meaningful Relevant Values NAMING DESCRIBING WORDING SYMBOLIZING PICTURING ANIMATING 4. Brand Design Schematic
Verbal Visual Brand Expression Meaningful Relevant Values NAMING DESCRIBING WORDING SYMBOLIZING PICTURING ANIMATING Home Computing Laptop Desktop PDA Tablet PC Price-Oriented Laptop Purchase Decision Compaq Presario DeskPro iPaq Armada EVO Value Pricing Volume Sales Computer Tradition Availability 4. Brand Design Schematic
5. Person Situation Segmentation Scheme Person Male/Female under 30 Male/female, over 40 Male/Female, 30-39 Less risk Brand reputation Dependable Organized Functionality Get more done Work Social status Cool design Self-image More trust Availability Less down time Save money Good price Frugal Situation School Less debt Low price Control of life Home
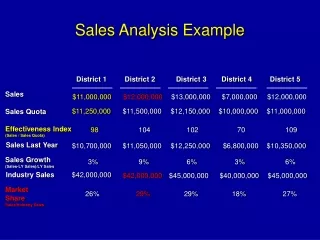
6. Importance Performance Analysis • Gap Analysis • Compare Focus Brand Performance scores with the attribute importance scores Example:
7. Marketing Strategy Q1. How should the firm market the core benefit, product, and augmented product?
7. Marketing Strategy • Q1. How should the firm market the core benefit, product, and augmented product?
7. Marketing Strategy • Regression/Correlation Analysis