Download
1 / 15
280 likes | 820 Views
Hydrosphere. Flood hydrographs. Hydrosphere. Flood hydrographs.

E N D
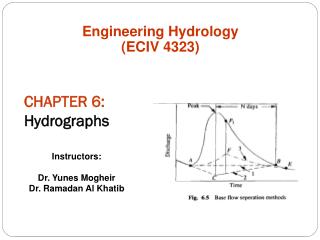
Hydrosphere Flood hydrographs
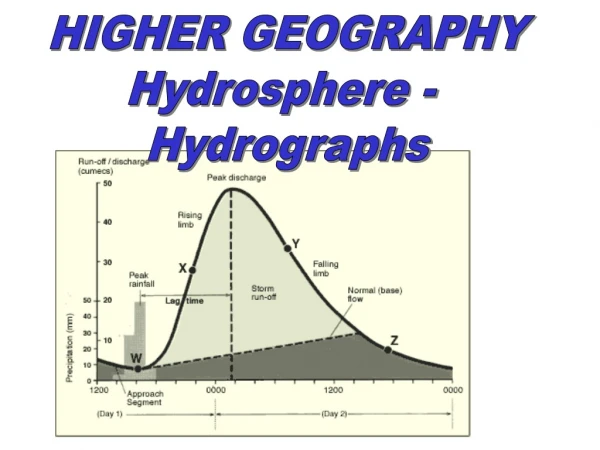
Hydrosphere Flood hydrographs Flood hydrographs show the effect that precipitation has on the water levels in a river. After a storm the water levels in rivers will increase. The rate of this increase and subsequent return to normal or base flow is determined by several factors. Discharge Cumecs (m3/s) 80 70 60 50 40 30 Precipitation (mm) 90 80 20 70 60 Base (normal) flow 50 10 40 30 20 10 0300 0600 0900 1200 1500 1800 2100 2400 0000 0300 0600 0000 Time
Hydrosphere Flood hydrographs The rainfall leading to the rise in river discharge is noted on the bar graph. Discharge Cumecs (m3/s) 80 70 60 50 40 30 Peak rainfall Precipitation (mm) 90 80 20 70 60 Base (normal) flow 50 10 40 30 20 10 0300 0600 0900 1200 1500 1800 2100 2400 0000 0300 0600 0000 Time
Hydrosphere Flood hydrographs The steady rise in discharge is shown by the rising limb. The point where the river has reached the point of maximum discharge is called the peak discharge and the return to a base flow is shown by the recession limb. Discharge Peak discharge Cumecs (m3/s) 80 70 Recession (receding) limb 60 Rising limb 50 40 30 Peak rainfall Precipitation (mm) 90 80 20 70 60 Base (normal) flow 50 10 40 30 20 10 0300 0600 0900 1200 1500 1800 2100 2400 0000 0300 0600 0000 Time
Hydrosphere Flood hydrographs The time delay between the peak rainfall and peak discharge is due to the fact that most rain will fall onto the land rather than into a river and so these two events will not be simultaneous. Discharge Peak discharge Cumecs (m3/s) 80 70 Recession (receding) limb 60 Rising limb 50 Lag time 40 30 Peak rainfall Precipitation (mm) 90 80 20 70 60 Base (normal) flow 50 10 40 30 20 10 0300 0600 0900 1200 1500 1800 2100 2400 0000 0300 0600 0000 Time
Hydrosphere Flood hydrographs Factors affecting hydrographs Hydrograph Steep long profile Gentle long profile The shape of a hydrograph is determined by several factors: Relief: The steeper the slopes the faster the water flows overland into rivers, making the rising limb steeper. If land is more gently sloping water flows over it more slowly and is therefore more likely to infiltrate into the soil – throughflow is slower than overland flow so the resulting rising limb will be less steep. This makes the lag time for the steep long profile shorter too.
Hydrosphere Flood hydrographs Factors affecting hydrographs Hydrograph Vegetation No vegetation The shape of a hydrograph is determined by several factors: Vegetation: The presence of vegetation in a river basin will firstly slow the flow of overland flow into rivers, due to interception, making a less steep rising limb with a longer lag time. Secondly, the peak flow for this river with vegetation will be lower because some of the rain that falls will be absorbed and used by the plants, reducing the amount of water that enters the river.
Hydrosphere Flood hydrographs Factors affecting hydrographs Hydrograph High drainage density Low drainage density The shape of a hydrograph is determined by several factors: Drainage density: A river basin with many tributaries (high drainage density) will offer many opportunities for overland flow, which flows more quickly and so the rising limb will be steeper with a shorter lag time. Conversely where there is a lower drainage density there will be more throughflow, which is slower leading to a gentler rising limb and a longer lag time.
Hydrosphere Flood hydrographs Factors affecting hydrographs Hydrograph Large basin Small basin The shape of a hydrograph is determined by several factors: Basin size: A large river basin will collect more water than a smaller one, potentially leading to a higher peak flow. As there are larger areas to cover though, the lag time will be greater in a larger basin
Hydrosphere Flood hydrographs Factors affecting hydrographs The shape of a hydrograph is determined by several factors: Surface type: Run-off will occur quickly where the surface is impermeable eg impermeable rocks/concrete. A steeper rising limb is the result. Where the surface is impermeable eg deep soils/permeable rock (like some clays) infiltration occurs, increasing throughflow and thus making the rising limb less steep.
Hydrosphere Flood hydrographs Factors affecting hydrographs 3 Soil Type: The deeper the soil the more water can be absorbed. Soils which have larger particle sizes (e.g those derived from the weathering of sandstones) have larger infiltration capacities. lower the rate of infiltration/faster the rate of run-off when the soil is saturated (saturated overland flow) or when rainfall intensity (rate per unit of time) is high (infiltration excess over land flow).
Hydrosphere Flood hydrographs FLOOD HYDROGRAPHS
Hydrosphere Flood hydrographs FLOOD HYDROGRAPHS
Hydrosphere Flood hydrographs Discharge Cumecs (m3/s) 80 70 60 50 40 30 Precipitation (mm) 90 80 20 70 60 50 10 40 30 20 10 0300 0600 0900 1200 1500 1800 2100 2400 0000 0300 0600 0000 Time
Hydrosphere Flood hydrographs FLOOD HYDROGRAPHS


![Hydrographs [Date] Today I will: - Be able to construct and understand flood hydrographs](https://cdn3.slideserve.com/5580541/hydrographs-date-today-i-will-be-able-to-construct-and-understand-flood-hydrographs-dt.jpg)