Download
1 / 17
220 likes | 406 Views
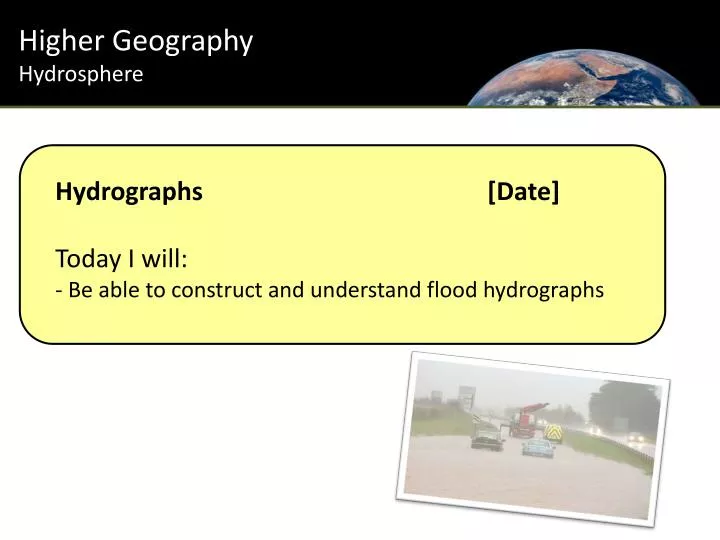
Higher Geography Hydrosphere. Hydrographs [Date] Today I will: - Be able to construct and understand flood hydrographs. Higher Geography Hydrosphere.

E N D
Higher Geography Hydrosphere Hydrographs [Date]Today I will:- Be able to construct and understand flood hydrographs
Higher Geography Hydrosphere What is a hydrograph?A hydrograph is a graph showing the rate of flow (discharge) versus time past a specific point in a river. The rate of flow is typically expressed in cubic meters (m3).They are used to show how rivers respond to a flood. Hydrographs are used to help predict flooding events therefore influence implementation of flood prevention measures.
Higher Geography Hydrosphere
Higher Geography Hydrosphere
Higher Geography Hydrosphere
Basin lag time Peak flow 3 Rising limb Overland flow Recession limb 2 Discharge (m3/s) mm 4 Through flow 1 3 2 Base flow 0 12 24 36 48 30 72 Hours from start of rain storm
3 Discharge (m3/s) 2 1 0 12 24 36 48 30 72 Hours from start of rain storm The discharge of the river is measured in cumecs - this stands for cubic metres per second
Rainfall expressed in mm 3 2 mm Discharge (m3/s) 4 1 3 2 0 12 24 36 48 30 72 Hours from start of rain storm
Discharge in m3/s, as a line graph 3 2 mm Discharge (m3/s) 4 1 3 2 0 12 24 36 48 30 72 Hours from start of rain storm
The rising limb is when the normal (base) flow of the river starts to rise when run-off, ground and soil water reaches the river. 3 Rising limb 2 mm Discharge (m3/s) 4 1 3 2 0 12 24 36 48 30 72 Hours from start of rain storm
Peak flow 3 Peak flow is when the Maximum discharge in the river, the time when the river reaches its highest flow Rising limb 2 mm Discharge (m3/s) 4 1 3 2 0 12 24 36 48 30 72 Hours from start of rain storm
Peak flow The recession limb shows that water is still reaching the river but in decreasing amounts 3 Rising limb Recession limb 2 mm Discharge (m3/s) 4 1 3 2 0 12 24 36 48 30 72 Hours from start of rain storm
The basin lag time is the time it takes for the water to find its way to the river Basin lag time Peak flow 3 Rising limb Recession limb 2 mm Discharge (m3/s) 4 1 3 2 0 12 24 36 48 30 72 Hours from start of rain storm
Basin lag time Base Flow is the normal discharge of the river Peak flow 3 Rising limb Recession limb 2 mm Discharge (m3/s) 4 1 3 2 Base flow 0 12 24 36 48 30 72 Hours from start of rain storm
Overland flow Basin lag time + Peak flow Through flow 3 = Rising limb Overland flow Recession limb Storm Flow 2 mm Discharge (m3/s) 4 Through flow 1 3 2 Base flow 0 12 24 36 48 30 72 Hours from start of rain storm
Higher Geography Hydrosphere Read the information on page 230 and 231 of the NWW Textbook. Copy the table below into your jotter and fill in the information gathered. Reasons for Differences in Flood Hydrographs
Higher Geography Hydrosphere Can you label 1 to 8 accurately? 7. 1. 6. 8. 5. 4. 2. 3.


![Symbols [Date] Today I will: - Be able to identify the main symbols using a key](https://cdn1.slideserve.com/2524033/slide1-dt.jpg)