Download

1 / 37
390 likes | 642 Views
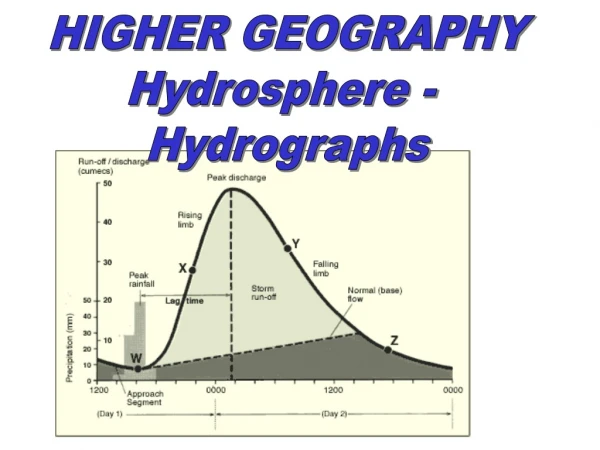
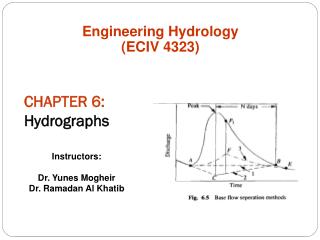
Construction And Analysis Of Hydrographs. Basin lag time. Peak flow. Flood Hydrograph. 3. Rising limb. Overland flow. Recession limb. 2. mm. Discharge (m 3 /s). 4. Through flow. 1. 3. 2. Base flow. 0 12 24 36 48 60 72. Hours from start of rain storm.

E N D
Construction And Analysis Of Hydrographs
Basin lag time Peak flow Flood Hydrograph 3 Rising limb Overland flow Recession limb 2 mm Discharge (m3/s) 4 Through flow 1 3 2 Base flow 0 12 24 36 48 60 72 Hours from start of rain storm
rivers mean (average) velocity = cross sectional area X (at a particular point in its course) Hydrograph Record of River Discharge over a period of time RiverDischarge Storm Hydrographs Show the change in discharge caused by a period of rainfall
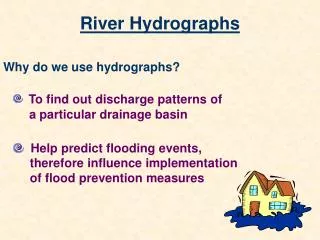
Why Construct & Analyse Hydrographs ? • To find out discharge patterns of • a particular drainage basin • Help predict flooding events, • therefore influence implementation of flood prevention measures
Construction Of Storm (flood) Hydrographs
Basin lag time Peak flow Flood Hydrograph 3 Rising limb Overland flow Recession limb 2 mm Discharge (m3/s) 4 Through flow 1 3 2 Base flow 0 12 24 36 48 60 72 Hours from start of rain storm
3 2 Discharge (m3/s) 1 0 12 24 36 48 60 72 Hours from start of rain storm
Rainfall shown in mm, as a bar graph 3 2 mm Discharge (m3/s) 4 1 3 2 0 12 24 36 48 60 72 Hours from start of rain storm
Discharge in m3/s, as a line graph 3 2 mm Discharge (m3/s) 4 1 3 2 0 12 24 36 48 60 72 Hours from start of rain storm
Rising limb The rising flood water in the river 3 Rising limb 2 mm Discharge (m3/s) 4 1 3 2 0 12 24 36 48 60 72 Hours from start of rain storm
Peak flow Peak flow Maximum discharge in the river 3 Rising limb 2 mm Discharge (m3/s) 4 1 3 2 0 12 24 36 48 60 72 Hours from start of rain storm
Recession limb Peak flow Falling flood water in the river 3 Rising limb Recession limb 2 mm Discharge (m3/s) 4 1 3 2 0 12 24 36 48 60 72 Hours from start of rain storm
Basin lag time Basin lag time Peak flow Time difference between the peak of the rain storm and the peak flow of the river 3 Rising limb Recession limb 2 mm Discharge (m3/s) 4 1 3 2 0 12 24 36 48 60 72 Hours from start of rain storm
Base flow Basin lag time Peak flow Normal discharge of the river 3 Rising limb Recession limb 2 mm Discharge (m3/s) 4 1 3 2 Base flow 0 12 24 36 48 60 72 Hours from start of rain storm
Overland flow Basin lag time + Peak flow Through flow 3 = Rising limb Overland flow Recession limb 2 Storm Flow mm Discharge (m3/s) 4 Through flow 1 3 2 Base flow 0 12 24 36 48 60 72 Hours from start of rain storm
Overland flow Through flow Volume of water reaching the river through the soil and underlying rock layers Volume of water reaching the river from surface run off
Basin lag time Peak flow 3 Rising limb Overland flow Recession limb 2 mm Discharge (m3/s) 4 Through flow 1 3 2 Base flow 0 12 24 36 48 30 72 Hours from start of rain storm
Factors influencing Storm Hydrographs • Area • Shape • Slope • Rock Type • Soil • Land Use • Drainage Density • Precipitation / Temp • Tidal Conditions
Overland flow Through flow Base flow Interpretation of Storm Hydrographs Basin lag time You need to refer to: Peak flow 3 • Rising Limb Rising limb 2 Recession limb mm • Recession Limb Discharge (m3/s) 4 1 3 • Lag time 2 • Rainfall Intensity 0 12 24 36 48 30 72 Hours from start of rain storm • Peak flow compared to Base flow • Recovery rate, back to Base flow
Following, are some theoretical interpretations of influencing factors BUT………… When interpreting hydrographs all factors must be considered together !
Area Large basins receive more precipitation than small therefore have larger runoff Larger size means longer lag time as water has a longer distance to travel to reach the trunk river Area Rock Type Drainage Density Shape Soil Precipitation / Temp Slope Land Use Tidal Conditions
Shape Elongated basin will produce a lower peak flow and longer lag time than a circular one of the same size Area Rock Type Drainage Density Shape Soil Precipitation / Temp Slope Land Use Tidal Conditions
Slope Channel flow can be faster down a steep slope therefore steeper rising limb and shorter lag time Area Rock Type Drainage Density Shape Soil Precipitation / Temp Slope Land Use Tidal Conditions
Rock Type Permeable rocks mean rapid infiltration and little overland flow therefore shallow rising limb Area Rock Type Drainage Density Shape Soil Precipitation / Temp Slope Land Use Tidal Conditions
Soil Infiltration is generally greater on thick soil, although less porous soils eg. clay act as impermeable layers The more infiltration occurs the longer the lag time and shallower the rising limb Area Rock Type Drainage Density Shape Soil Precipitation / Temp Slope Land Use Tidal Conditions
Land Use Urbanisation - concrete and tarmac form impermeable surfaces, creating a steep rising limb and shortening the time lag. Steeper recession limb. WHY? • RISING LIMB / LAG TIME: • Shallower in rural areas – increased interception • Vegetation intercepts and stores water slowing it’s passage into the river system • In Urban areas concrete, tarmac etc. channels water quickly into drains and straight into river / sewage system
Land Use Urbanisation - concrete and tarmac form impermeable surfaces, creating a steep rising limb and shortening the time lag. Steeper recession limb. WHY? • STORAGE: • Falling limb will be steeper on an urban hydrograph due to lack of infiltration, storage • In rural areas water will continue to flow into the river for many hours from underground flow and through flow • The return to base flow is much slower in rural areas
Land Use Urbanisation - concrete and tarmac form impermeable surfaces, creating a steep rising limb and shortening the time lag. Steeper recession limb. WHY? Afforestation - intercepts the precipitation, creating a shallow rising limb and lengthening the time lag. Shallower recession limb. WHY? Area Rock Type Drainage Density Shape Soil Precipitation / Temp Slope Land Use Tidal Conditions
Drainage Density A higher density will allow rapid overland flow Area Rock Type Drainage Density Shape Soil Precipitation / Temp Slope Land Use Tidal Conditions
Precipitation & Temperature Short intense rainstorms can produce rapid overland flow and steep rising limb If there have been extreme temperatures, the ground can be hard (either baked or frozen) causing rapid surface run off Snow on the ground can act as a store producing a long lag time and shallow rising limb. Once a thaw sets in the rising limb will become steep Area Rock Type Drainage Density Shape Soil Precipitation / Temp Slope Land Use Tidal Conditions
Tidal Conditions High spring tides can block the normal exit for the water, therefore extending the length of time the river basin takes to return to base flow Area Rock Type Drainage Density Shape Soil Precipitation / Temp Slope Land Use Tidal Conditions
Remember these influencing factors will: Influence each other Change throughout the rivers course
ANALYSING HYDROGRAPHS • Discharge does not increase immediately (only a small amount of precipitation falls directly into the river) • Water reaches the river from overland flow / surface run-off • This is then supplemented with water from throughflow • Rising limb shows overland flow • Recession limb indicates there is still water in the system – e.g. throughflow • Rivers with a short lag time and high discharge are most likely to flood • Two basins which receive the same amount of rain can have very different flood hydrographs
ANALYSING HYDROGRAPHS • ____ ____ will be higher in larger basins • 2. If slopes are steep, ______ will be lower, therefore peak flow will be greater • If basin is flatter, there will be more infiltration resulting in • peaks • The _______ the slope – the shorter the lag time • A combined atmosphere / hydrosphere question can appear: • ITCZ • Hydrographs Peak Flow infiltration lower steeper
FLOOD HYDROGRAPHS TASK: Using pages 43 55 Answer questions 1 5 on page 68-69 under the heading ‘Flows and Flood Hydrographs’
PAST PAPER QUESTIONS 2006 – Hydrosphere Remember to double marks when looking pre-2008


![Hydrographs [Date] Today I will: - Be able to construct and understand flood hydrographs](https://cdn3.slideserve.com/5580541/hydrographs-date-today-i-will-be-able-to-construct-and-understand-flood-hydrographs-dt.jpg)