Download
1 / 30
300 likes | 458 Views
Characterization of Pacific Northwest Softwoods for Wood Composites Production. Chris Langum & Vikram Yadama Department of Civil and Environmental Engineering Wood Materials and Engineering Laboratory Washington State University Eini Lowell USDA FS PNW Res. Station, Portland, OR

E N D
Characterization of Pacific Northwest Softwoods for Wood Composites Production Chris Langum & Vikram Yadama Department of Civil and Environmental Engineering Wood Materials and Engineering Laboratory Washington State University Eini Lowell USDA FS PNW Res. Station, Portland, OR April 26th, 2007 Wood Materials & Engineering Laboratory
Presentation Outline • Background & Justification • Objectives & Tasks • Methodology • Results • Conclusions Wood Materials & Engineering Laboratory
Introduction Wood Materials & Engineering Laboratory
Changing Resources • Increasing environmental pressures have caused a change in available timber resources Wood Materials & Engineering Laboratory
Young trees are composed of primarily juvenile timber Undesirable qualities of juvenile timber include: Reduced mechanical properties Increased longitudinal shrinkage Lower density Leads to low-value lumber Composites negate some of these effects Juvenile Lumber Wood Materials & Engineering Laboratory
Wood Composites • Lumber • Veneers • Strands • Particles • Fiber bundles • Flour • Fibers • Cellulose Increasing Energy Decreasing Size Less Labor but increasing capital Increasing Formability Increase in surface area per pound of wood Decrease in Strength/wt. ratio Increasing homogeneity Lower quality raw material acceptable Engineered for specific properties & applications Wood Materials & Engineering Laboratory
Literature Review • Juvenile/Mature timber transition age • Jozsa, Middleton, DeBell (western hemlock) – Age 25-40 yrs. • Abdel-Gadir, Krahmer (Douglas-fir) – Age 30 yrs. • Juvenile timber properties • Studied by many; however, not much focus on tensile properties • Olson (1996) • Studied density, pH, and furnish characteristics of lodgepole pine, western larch, and Douglas-fir • Found species had an effect on panel properties; however, all species were suitable for wood composites • Strand properties • Price, Mahoney, Jahan-Latibari, Yadama • Strands have significantly lower mechanical properties (up to 50%) Due to processing induced damage Wood Materials & Engineering Laboratory
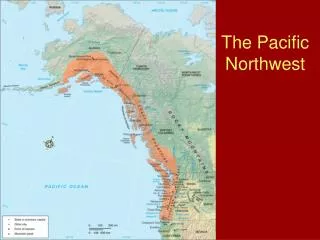
Project Parameters • 12 Douglas-Fir (Pseudotsuga menziesii) • Diameter ranged from 7.5” – 11.5” • 12 Western Hemlock (Tsuga heterophylla) • Diameter ranged from 6.3” – 11.2” • Trees selected from American Mill Site near Aberdeen, WA (Installation No. 727) • Harvested logs were processed at Wood Materials and Engineering Laboratory, WSU Wood Materials & Engineering Laboratory
Objectives Wood Materials & Engineering Laboratory
Characterize variation in physical and mechanical properties of small diameter, fast-grown Douglas-fir and western hemlock clear specimens and wood furnish, for wood-based composites, as a function of location within the trees Research Objective Wood Materials & Engineering Laboratory
Task 1: Determine density profiles of specimens through X-ray densitometry to establish zones where changes in mechanical properties may be encountered. Task 2: Test small clear specimens in tension parallel to grain, compression parallel to grain, and flexure by location to determine the extent of variation in mechanical properties with respect to height and diameter. Small Clear Specimens Wood Materials & Engineering Laboratory
Task 1: Investigate differences in particle size distributions relative to tree height and radius when converted into wood flour. Task 2: Examine pH and buffering capacities of wood and their variation as a function of location within a tree. Task 3: Evaluate mechanical properties of strands produced from different locations within a tree and correlate these properties with previously discussed small clear specimen properties. Wood Furnish For Composites Wood Materials & Engineering Laboratory
Methodology Wood Materials & Engineering Laboratory
Sample Preparation Tension Bending Compression Density profiles Moisture content Wood Materials & Engineering Laboratory
Small Clear Specimens • Static Bending 0.05 Laser Extensometer Modulus of Elasticity Modulus of Rupture • Tension Parallel to Grain 0.05 2” Epsilon Axial Extensometer Young’s Modulus Rupture Stress • Compression Parallel to Grain 0.012 2” Epsilon Axial Extensometer Young’s Modulus Rupture Stress Crosshead Speed (in./min.) Measurement Instrumentation Properties Calculated Tests according to ASTM D143-94: Standard Test Methods for Small Clear Specimens of Timber Wood Materials & Engineering Laboratory
Wood Furnish Twelve trees combined based on location • Particle Size Distribution • RoTap sieve shaker and screen of 20, 40, 60, 80, 100, and 120 mesh along with pan used to create distribution profiles • pH and Buffering Capacity • 25 g wood flour and 250 g water refluxed for 20 minutes, aspirator filtered, and allowed to cool to room temperature. • Sulfuric acid (H2SO4) used to titrate to pH of 3.0 • Sodium hydroxide (NaOH) used to titrate to pH of 7.0 • Method according to Johns and Niazi (1980) • Tensile Properties of Strands • Crosshead speed of 0.015 in./min. • ½” gage length Epsilon axial extensometer • Method according to Yadama (2002) Wood Materials & Engineering Laboratory
Results Wood Materials & Engineering Laboratory
Density Profiles Density profiles for Douglas-Fir match closely those published in Wood and Fiber Science Courtesy of Wood and Fiber Science Wood Materials & Engineering Laboratory
Clear Specimen Properties Wood Materials & Engineering Laboratory
Comparison of means by Duncan’s T-test MOE and MOR Variation – D-fir Wood Materials & Engineering Laboratory
MOR & MOE Variation – W. Hemlock Wood Materials & Engineering Laboratory
Douglas-Fir Western Hemlock Particle Size Distribution • Douglas-fir wood flour contained a greater overall percent of fines. • Western hemlock wood flour produced larger particles through same processing parameters. • Little variation occurred between locations with the exception of the middle-pith location in both species. Wood Materials & Engineering Laboratory
pH and Buffering Capacity Douglas-Fir (pH = 4.38) Western Hemlock (pH = 4.98) • Douglas-fir was more resistant to changes in pH from bases (Sodium Hydroxide) • Limited variation between locations regardless of species Wood Materials & Engineering Laboratory
Douglas-Fir Ave. Ex = 934,410 psi vs. 1.51x10⁶ psi Ave. rupture stress = 4,400 psi vs. 9,890 psi Strand Properties Western Hemlock • Ave. Ex = 874.330 psi vs. 1.11x10⁶ psi • Ave. rupture stress = 4,100 psi vs. 9,380 psi • No variation in strength or stiffness with respect to height; however, stiffness tends to increase as you go from bottom to top log contrary to strength • Radial location had greatest affect on strength – mid region tends to yield better quality strands Wood Materials & Engineering Laboratory
Transformation Equations Estimate other elastic constants Western Hemlock • E1 = 971,529 psi • n12 = 0.518 • G12 = 32,965 psi • E2 = 34,145 psi Douglas-Fir • E1 = 1,117,332 psi • n12 = 0.535 • G12 = 13,281 psi • E2 = 25,521 psi Wood Materials & Engineering Laboratory
Strand Stiffness Properties Estimating strand properties from clear specimen properties (Douglas-Fir only) • Strand Young’s Modulus = 934,410 psi • Flexural MOE = 1,330,000 psi • Tensile YM = 1,510,000 psi • Compressive YM = 1,420,000 psi • Ratio of • Strand YM / Flex. MOE = 0.71 • Strand YM / Tens. YM = 0.62 • Strand YM / Comp. YM = 0.66 • W. Hemlock: 0.82, 0.79, 0.84 Wood Materials & Engineering Laboratory
Strand Strength Properties Estimating strand properties from clear specimen properties (Douglas-Fir only) • Strand Rupture Stress = 4,403 psi • Flexural MOR = 9,570 psi • Tensile Rupture Stress = 9,890 psi • Compressive Rupture Stress = 4,840 psi • Ratio of • Strand RS / Flex. MOR = 0.46 • Strand RS / Tens. RS = 0.45 • Strand RS / Comp. RS = 0.91 • W. Hemlock: 0.48, 0.44, 1.02 Wood Materials & Engineering Laboratory
Conclusions Small Clear Specimens • Flexure: • Significant decrease in strength and stiffness from bottom to top and pith to bark of both species. • Compression: • Both species strength unaffected by height (with exception of WH lower bolt, which was significantly larger). • Both species strength unaffected by radial location. • Stiffness was significantly lower at pith for both species. • WH stiffness unaffected by height. • Tension: • Both species possessed highest strength at bottom bolt and no significant difference occurred beyond. • Strength increased in both species with distance from the pith. • Stiffness was unaffected by height in either species. • Stiffness increased with distance from pith in DF; however WH decreased significantly from the middle to outer zone. Wood Materials & Engineering Laboratory
Conclusions (Cont.) Strand Properties • pH and Buffering Capacity: • Both species indicated little variation with respect to location with the exception of the lower pith location. • DF – more acidic • Particle Size Distribution: • DF – Most particles were retained by the #60 sieve and more fines were produced when compared to western hemlock. • WH – Equal amounts were retained by #40 and #60 sieve which equates to larger particles being produced under identical processing parameters • Strands: • Little variation occurred in either species with respect to strength and even less variation occurred with respect to stiffness as indicated by K-S test. • Reduction factors were calculated for estimation of strand properties with clear specimen data. • Stiffness reduced by 30-40% in DF & 15-20% in WH • Strength reduced by 50-55% in both species Wood Materials & Engineering Laboratory
Acknowledgments • USDA FS PNW Research Station, Portland, Oregon • Stand Management Cooperative for materials, field work in harvesting them, and transportation Wood Materials & Engineering Laboratory