Download
1 / 38
450 likes | 780 Views
General Phase Diagram Sections. Arthur D. Pelton C entre de R echerche en C alcul T hermochimique École Polytechnique de Montréal Montréal, Québec, CANADA. General rules of construction of all true phase diagram sections;

E N D
General Phase Diagram Sections Arthur D. Pelton Centre de Recherche en Calcul Thermochimique École Polytechnique de Montréal Montréal, Québec, CANADA General rules of construction of all true phase diagram sections; Proper choice of variables and constants to give a “true” phase diagram section (with a unique equilibrium state at each point); A general algorithm for calculating all true phase diagram sections. 1
Fe2O3-MgO-SiO2-O2 SystemSiO2/(Fe2O3+ MgO + SiO2) = 0.20 in air 11
The Law of Adjoining Phase Regions «As a phase boundary line is crossed, one and only one phase appears or disappears.» 14
(a1 + a2 + … + an) (a1 + a2 + … + an) (a1 + a2 + … + an) +b + g Anodein a general true phase diagram section. (a1 + a2 + … + an) +b+g 15
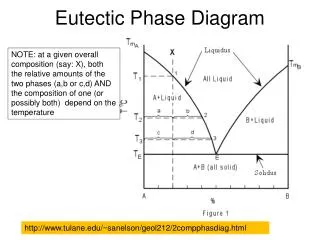
L a + L b + L a + b + L T a b a + b A B XB An isobaric binary temperature-composition diagram with the eutectic “opened-up” to show that this is an infinitely narrow3-phaseregion. 17
b a + b b + g a + b + g a f2 g a + g f1 A “potential-potential” phase diagram “opened-up” to show that the lines are infinitely narrow2-phaseregions. 19
Extensive Variables (notthe same for all phases at equilibrium) Xi (composition) V (volume) Potential Variables (the same for all phases at equilibrium) T (temperature) P (pressure) mi(chemical potential) 20
If only potential variables are held constant, then all tie-lines lie in the plane of the section. In this case, the compositions of the individual phases at equilibrium can be read from the diagram and the lever rule applies. 21
MCfccbccM7C3M23C6 Zero Phase Fraction (ZPF) Lines 22
aLIQUIDb LIQUID Liquidus Solidus LIQUID + a L+b SOLID a SOLID b 2 SOLIDS(a + b) Solvus line Solvus line Zero Phase Fraction (ZPF) Lines 23
Choice of variables to always give a true phase diagram (single-valued) everywhere 25
Gibbs-Duhem: N-Component System (A-B-C-…-N) Phase Diagram 26
Choice of variables N-component system (1) Choose n potentials: f1, f2, … , fn (2) From the non-corresponding extensive variables (qn+1, qn+2,… ), form (N+1-n) independent ratios (Qn+1, Qn+2, …, QN+1). Example: [f1, f2, … , fn; Qn+1, Qn+2, …, QN+1] are then the (N+1) variables of which 2 are chosen as axes and the remainder are held constant. Phase Diagram 27
ST V-P nMgOmMgO nCaOmCaO f1 =T f2 =-P MgO-CaO Binary System Phase Diagram 28
ST V -P nFemFe nCrmCr f1 = T f2 = -P Fe-Cr-S-O System Phase Diagram 30
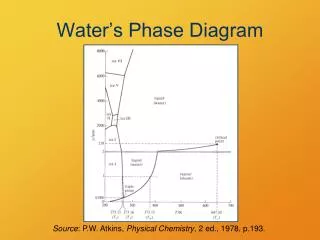
S+L P L+G S+G V Pressure vs. Volume diagram for H2O This is NOT a true phase diagram. Phase Diagram 32
S T V -P nC mC nFemFe nCrmCr f1 = T f2 = -P f3 = mC (NOT OK) (OK) Fe-Cr-C System Requirement: Phase Diagram 33
1.0 0.9 M23C6 0.8 0.7 M7C3 0.6 Mole fraction of Cr 0.5 0.4 0.3 bcc 0.2 0.1 fcc 0 -3 -2 -1 0 1 2 cementite log(ac) Fe-Cr-C system, T = 1300 K, XCr = nCr/(nFe+nCr+nC) vs. (carbon activity) This is NOT a true phase diagram. Phase Diagram 34
Liquid iron + liquid oxide Liquid iron Liquid iron Liquid oxide Liquid oxide 1900 d-Iron 1700 Wustite Wustite 1500 Temperature (K) g-Iron Hematite + Magnetite g-Iron + Wustite 1300 Magnetite a-Iron 1100 a-Iron + Wustite Wustite + Magnetite 900 Hematite + Oxygen Hematite a-Iron + Magnetite 700 -500 -400 -300 -200 -100 0 0 0.50 0.54 0.58 0.62 Mole fraction XO RT ln PO2(kJ) “Corresponding” phase diagrams of the Fe-O system 35
Other Sets of Extensive Variables and Corresponding Potentials Gibbs-Duhem: Gibbs-Duhem: 36