Download
1 / 6
60 likes | 187 Views
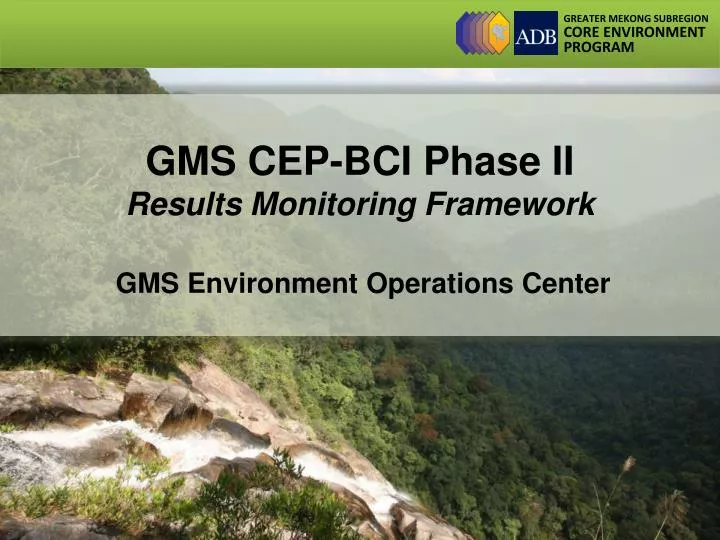
GMS CEP-BCI Phase II Results Monitoring Framework GMS Environment Operations Center. Monitoring during Phase 1. Multiple different sets of monitoring Program DMF DPSIR monitoring framework developed to track BCI and other program elements (impact level) Financial monitoring

E N D
GMS CEP-BCI Phase II Results Monitoring Framework GMS Environment Operations Center
Monitoring during Phase 1 • Multiple different sets of monitoring • Program DMF • DPSIR monitoring framework developed to track BCI and other program elements (impact level) • Financial monitoring • Activity monitoring under LoAs • Challenges and opportunities • Lack of consistent follow up and application of MF • Fragmentation of information collection and reporting • Opportunities for Phase 2 • Transition from monitoring inputs and outputs / activity delivery to tracking results at a program level
Phase 2 Results Monitoring Framework • Level 1: GMS development trends • IMPACT LEVEL • Tracked through: GMS Statistics • What progress has been made on development in the GMS? • How effective have CEP-BCI activities been in contributing to development outcomes? • Level 2: Effectiveness of CEP-BCI interventions • OUTCOME AND OUTPUT LEVEL • Tracked through: DMF annual updates, progress reporting • Level 3: CEP-BCI operational efficiency • INPUT LEVEL • tracked through: Annual financial, administration reports and program evaluations • How efficient are CEP-BCI operations and staff?
Level 1: GMS Development Trends • Tracks IMPACT level trends – Changes in these trends are a result of cumulative efforts of all partners over time. • Adapted DPSIR framework from Phase 1; Applicable at four levels: Regional, National, Landscape / Provincial and Site level • Examples of themes tracked: changing demographic situation, dependence on primary resources, climate change, land use change • Tracked through: GMS-EOC interactive web tools (GMS Statistics, Interactive Atlas)
Level 2: Effectiveness of CEP-BCI interventions • Tracks OUTPUTS and OUTCOMES which can be linked directly to CEP-BCI • Components and subcomponents: Targets for 2016 outlined in program DMF; Annual milestones and indicators proposed in component strategies (2013 to 2015) • Activity level indicators and targets developed during activity scoping • Reported through EOC and NSU progress reporting to WGE, individual activity progress reporting
Level 3: Efficiency of EOC operations • Tracks inputs and operational (financial and staff) efficiency of EOC • Some examples: • Program performance (Timeliness of reporting, % of annual milestones met, effectiveness and relevance rating during program evaluation) • Financial mobilization (% overheads / EOC cost, annual disbursement and liquidation ratios) • EOC / NSU staff resources (gender, GMS nationals, NSU participation) • Reported through EOC and NSU progress reports to WGE