Download
1 / 30
310 likes | 509 Views
ESTIMATING ANIMAL ABUNDANCE. Brian L. Pierce, Roel R. Lopez, and Nova J. Silvy. Department of Wildlife and Fisheries Sciences Texas A&M University College Station, TX 77845. Prologue.

E N D
ESTIMATING ANIMAL ABUNDANCE Brian L. Pierce, Roel R. Lopez, and Nova J. Silvy Department of Wildlife and Fisheries Sciences Texas A&M University College Station, TX 77845
Prologue • Leopold (1933) stated that “measurement of the stock on hand” was the essential first step in any wildlife management effort.
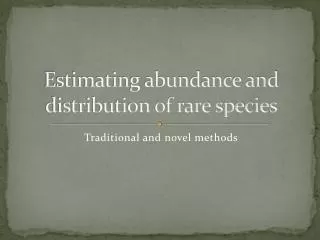
Introduction • Herein we provide an overview of factors that should be considered before choosing a method to estimate population abundance, the pros and cons of using various methods, and available computer software, so that the reader may make informed decisions based upon their particular needs.
Statistical Definitions • Population: A group of animals of the same species occupying a given area (study area) at a given time. • Absolute abundance: Number of individuals. • Relative abundance: Number of individuals within a population at 1 place and/or time period, relative to the number of individuals in a different place and/or time period. • Population density: Number of individuals per unit area. • Relative density: Density within 1 place and/or time period, relative to the density in another place and/or time period. • Population trend: Change in numbers of individuals over time. • Census: A total count of an animal population. • Census method: The method (i.e., spotlight count) used to obtain data for an estimate of population abundance.
Statistical Definitions • Population estimate: A numerical approximation of total population size. • Population estimator: A mathematical formula used to compute a population estimate calculated from data collected from a sampled animal population. • Closed population: A sampled population where births, deaths, emigration, and immigration does not occur during the sampling period. • Open population: A sampled population this is not closed. • Population index: A statistic that is assumed to be related to population size. • Detection probability: The probability that an individual animal within a sampled population is detected. Synonyms include: observability, sightability, catchability, detectability, or probability of detection.
Statistical Definitions • Parameter: An attribute (i.e., percent females) of a population. If you know the parameters of the population, you do not need statistics. • Statistic: An attribute (i.e., percent females) from a sample taken from the population. • Frequency of occurrence: Observed number of an attribute relative to total possible number of that attribute (e.g., individual was observed on 4 of 5 spotlight counts). • Accuracy: Is a measure of bias error, or how close a statistic (i.e., a population estimate) taken from a sample is to the population parameter (i.e., actual abundance). • Bias: The difference between an estimate of population abundance and the true population size. However, without knowledge of the true population size, bias is unknown. • Mean estimate: The average of repeated sample populations estimates usually taken over a short time period.
Statistical Definitions • Precision: Is a measure of the variation in estimates obtained from repeated samples. • Range: difference between lowest and highest estimates. • Variance: sum of the squared deviations of each n sample measurement from the mean divided by n−1. • Standard deviation: positive square root of the variance. • 95% confidence interval: probability that a given estimate will fall within ±2 standard errors of the mean. • Central Limit Theorem: the distribution of sample means calculated from an infinite number of successive random samples will be approximately normally distributed as the sample size (n) becomes larger, irrespective of the shape of the population distribution.
Precision Versus Accuracy Measures of statistical precision include: Range Variance Standard deviation Standard error Confidence interval In the real world of population estimation, one does not ever know where the bull’s eye lies; therefore, one can only measure precision of the estimates.
Survey Design: 20 Questions How will the sample units be distributed? Will sample units be drawn with or without replacement? Do I have the equipment and infrastructure necessary? Do I have sufficient funds to conduct the proposed survey? Is that money better spent on answering another question? Do I have the time required to complete the estimate? Do I have the expertise to collect and analyze the data, or is it available elsewhere? Are there other biologists and biometricians that can provide an independent review? Will I need a pilot study to answer any of the above questions? • Have I reviewed the relevant literature on the species and/or method? • Do I need an estimate of density or will an index of relative abundance suffice? • What methods are available which meet these criteria? • What is the extent of the survey area? • Are there any limitations as to where I can sample? • What are the experimental units from which samples will be drawn? • How much precision is desired? • If comparing areas or time periods, how small a difference must be detected? • Given the precision or difference to be detected, how much replication is required? • How much replication can I afford? • What is the distribution of the species to be surveyed?
Survey Design Because of the limits of time and costs, a survey of the entire study area of interest is usually not possible. An experimental design is devised to select a portion of the study area to be sampled (experimental units). Proper experimental design helps to minimize the effects of uncontrolled variation, allowing you to obtain unbiased estimates of abundance and experimental error (variation between experimental units treated alike).
Survey Design Survey extent: the spatial and temporal extent of the area over which inference is to be made. Experimental design: plan used to select the portion of the study area to be sampled, the number of replications, and the randomization rule used to assign treatments to experimental units. Experimental unit: is the smallest entity to which a treatment can be randomly assigned. They are homogenous and should be representative of the population or treatment to which inference is to be applied. Sample unit: the entity from which measurements are obtained. Treatment: manipulative (applied by the experimenter), mensurative(categories of time or space), or organismal (natural categories, such as age class or sex) division of experimental units.
Survey Design Replication: repeated sampling from each experimental unit. Randomization rule: used to ensure an unbiased assignment of treatments to experimental units. Simple random sampling: each sample unit has an equal probability of being selected. Stratified random sampling: employed when there are implicit differences in experimental material (prior to treatment) that must be accounted for in the analysis. Experimental units are categorized accordingly, and sample units selected randomly from within these categories. Systematic sampling: employed to ensure uniform coverage of area under investigation.
Survey DesignNon-probabilistic sampling Convenience sampling Selective sampling Regardless of cause or reason, non-probabilistic sampling designs are likely to yield biased estimates with levels of precision that are not representative of the area of inference.
Survey Design Sampling intensity:a concept that encompasses desired precision, statistical power, and the amount of variability among the sample units. Significance level: The odds that the observed result is due to chance Power: The odds that you will observe a treatment effect when it occurs. Effect size: Effect size is the difference between treatments (e.g., in number of animals seen) relative to the noise in measurements. Variation in the response variable: the sample variance or standard deviation are often used to estimate variability in the parameter of interest (e.g., population mean). Sample size: Sample size ( ) is the number of samples required to obtain the desired precision in an estimate, or the desired power in a hypothesis test.
Method Considerations Methods can be broadly categorized as either census methods or estimates derived from sampling, and further subdivided by complete or incomplete detection within samples. The combination of method and survey design then, in turn, dictates how samples may be combined to estimate population means and variances. Problems arise when animal distributions are clumped, or when the distribution of samples correlates with the underlying distribution of animals to be sampled. Most survey methods do not observe all individuals within the population, and detection probability may vary over space and/or time.
Indices A density index can be defined as any measure that correlates with density. Indices differ from population estimation methods in that only counts are obtained, with little or no attempt to correct for incomplete detection or variable detection probability. Most indices collect frequency (number of individual animals or animal sign) information along transects, at quadrats, or points. Indices are relatively inexpensive, and can be used to compare animal numbers between treatment and control areas (e.g., disked with non-disked areas) or to compare the same area over time, with the assumption that nothing changes except the relative abundance of the animal being studied.
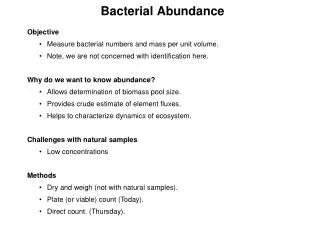
Census Total count of an entire population. The data obtained are not a sample, but enumeration of the whole population (i.e., no variability is present because you counted them all). Rare situations occur where this is useful. In most cases complete counts can not be made with certainty, and if animals are missed there are no means to detect bias nor assess the precision of the sample. In most cases data resulting from these methods should viewed skeptically.
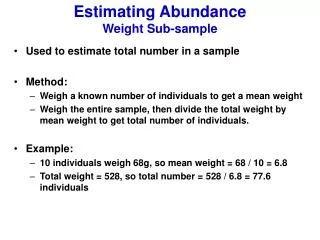
Sample Counts: Fixed Area Total counts on limited sample areas may be possible. The sample units must be suitable-sized relative to the organism being considered, to ensure a complete count is obtained. The area being counted is “fixed” in terms of the length and width of each sample prior to the start of the survey. The mean density from all sample plots is then extrapolated to the entire study area, giving an estimate of average density and/or population abundance for the area of inference. This basic sampling method has been modified to use sample units of various shape (quadrats, strips, plots, etc.) and size, depending on circumstance and target species.
Sample Counts: Plotless While methods of fixed area counts are common in both plant and animal sampling, they suffer from boundary effects, where a decision must be made to determine whether or not to include an observation on a plot boundary. Plant biologist developed several ‘plotless’ methods to estimate density and abundance that alleviate these problems and are relatively easy to apply, so long as the target remains in place or can be measured before it moves. They are ideally suited for sampling many animal cues such as active nest, burrows, or other animal activities that remain stationary. and they have the added advantage of being fast and easy to apply. Plotlessmethods work well when the target species is random or uniformly distributed, but many have problems when the target species is clumped or severely clumped in distribution.
Sample Counts: Estimating Area Considerable attention was give to conduct of sample counts during the 1930–1970’s, focusing on methods that would allow an accurate estimate of density to be obtained from counts without preset ½ strip widths. The basic solution had several forms, but each attempted to determine either the sample area congruent to the area over which complete counts were obtained, or the effective distance for the survey method (distance at which the number of animals counted beyond that distance is equal to the number of animals missed within that distance). In essence, these methods estimate the area (size of the plot) over which the counts occur. The sum of animals counted over the total estimated area provides an estimate of density.
Sample Counts: Estimating Area Hahn (1949) King (Leopold 1933, Buckland et al. 2001) Hayne (1949)
Incomplete Counts The preceding methods for estimating population size either reduced the survey area to assure complete detection, or attempted to correct the survey area to allow for unbounded counts. The strategy was to either standardize or estimate the survey parameters necessary to obtain accurate estimates without direct evaluation of detection probability. The incomplete count methods use the opposite strategy, where the focus is to either estimate detection probability directly, or to collect ancillary data to indirectly model detection probability.
Incomplete Counts Double sampling(Jolly 1969, Jolly 1969, Eberhardt and Simmons 1987, Pollock and Kendall 1987, Estes and Jameson 1988, Prenzlow and Lovvorn 1996, Anthony et al. 1999, Bart and Earnst 2002, and Laake et al. 2011) Double observer (Caughley 1974, Magnusson et al. 1978, Cook and Jacobson 1979, Grier et al. 1981, Caughley and Grice 1982, Pollock and Kendall 1987, Graham and Bell 1989, Nichols et al. 2000, and Laake et al. 2011) Marked sample (Chapman 1951, Packard et al. 1985, Samuel 1987, White 1996, Bartmann et al. 1987, White and Garrott 1990, Neal et al. 1993) Time of detection (Seber 1982, Ralph et al. 1995, Farnsworth et al. 2002, and Alldredge et al. 2007) Modern distance sampling (Burnham and Anderson 1984, Buckland et al. 2001)
Exploitative Removal methods of population estimation are old and have been analyzed by numerous investigators. These methods are attractive because often someone other than the investigator, such as hunters, can collect the removal data. Catch-per-unit-effort involves developing a linear regression of the number of animals removed each day on the cumulative total number of animals removed prior to that day (Leslie and Davis 1939). Animal can be removed without exploitation (catch & release, photographed, etc.). Change-in-ratio can be used on any 2 classes of animals as long as harvest varies between the classes (Kelker 1940). These methods assume a closed population, and that all removals are known. Estimates are imprecise and work well only when a large portion of the population is removed (exploitatively or non-exploitatively).
Removal Methods Catch-per-unit-effort (e.g., catch/day) is based on the premise that as more animals are removed from a population, fewer are available to be "caught", and catch per/day will decline. The regression equation is not a typical regression because the catch/day and the cumulative removals depend on the same removals. This lack of independence makes calculation of variances and 95% CI difficult.
Marked–Resight We prefer the term marked-resight because animals to not have to be captured to be marked, nor do they need to be recaptured to determine if they are marked. There is only 1 assumption to marked-resight methods and that is the proportion of marked to non-marked in a sample is the same as it is in the population. All other purported assumptions are just violations of this assumption. However, the percentage of marked animals in the population will affect the accuracy of the estimates, and we recommended at least 25% of the population be marked.
Marked–Resight Known Number Alive Lincoln-Petersen Estimator Schnabel Estimator Schumacher-Eschmeyer Estimator Jolly-SeberEstimator
Computer Software Program Capture Program MARK Program DISTANCE Program R
SUMMARY Before conducting a survey to estimate population abundance, understand what information is needed, what purpose the information will be used, how precise an estimate is needed, and the time needed and cost to conduct the survey. The key to deriving population abundance estimates is to select a method that fits a particular situation. If necessary, techniques can be adapted to meet a particular need. Generally, a biometrician familiar with population estimation literature should be consulted. However, most biometricians consider a method “best” when it has greater precision than another method, but remember that most of these methods have never been tested for accuracy under field conditions. Great precision does not mean accuracy.