Download
1 / 93
930 likes | 942 Views
Population: Canada and the World. Kicking the World Around With more problems than a soap opera plot the Earth is currently plagued with issues that we should all be concerned with. SEVEN BILLION AND COUNTING…. What are some concerns caused by a growth in population?

E N D
Kicking the World AroundWith more problems than a soap opera plot the Earth is currently plagued with issues that we should all be concerned with.
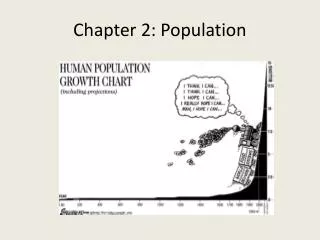
SEVEN BILLION AND COUNTING… What are some concerns caused by a growth in population? • shortages in energy, housing, food • increase in pollution, unemployment, environmental destruction • at what point will the planet cease to support its population?
optimists: believe population will increase to nine billion in 2054 and then level off at ten billion after 2100 • after that, technology will provide for increase numbers • others argue that population is not the cause of poverty, hunger, and environmental destruction but power dynamics, overconsumption, and unequal distribution of wealth
There is enough wealth in this land for everyone’s need, but not enough for everyone’s greed. ~ Mahatma Gandhi
two thousand ya: 300,000,000 people on earth • 1804: one billion • 1900: 2 billion • 2015: 7.2 billion • between 8000 BCE and 1750 CE, 70,000 added each year • today, 70,000 in seven hours IT IS THE RATE OF INCREASE THAT IS SIGNIFICANT
Instead of controlling the environment for the benefit of the population, maybe we should control the population to ensure the survival of our environment. ~Sir David Attenborough - The Life of Mammals
Demography1.statistical study of populations, used to understand causes and consequences of population change Why do governments and business wish info on population change? 2. to provide services and sell goods For example: imagine you are opening a sporting goods store. What kind of demographic information would you want in order to decide where to locate?
The Census: Counting People 3. First census – Babylon, Ancient Egypt and Rome – through to Medieval - to identify people for taxation, labour and military service
Why do you think census records are kept private for 92 years in Canada? • to protect privacy Good: very few live to 100 so personal privacy is protected • people may be reluctant to provide info if it would be made public in their lifetime Bad: historians and other professionals would find many uses for this data • people are more interested in genealogy today and would like access Who keeps all our information? Statistics Canada, a government ministry Controversy: 2006, Canada contracted out the Census to Lockheed Martin, a US weapons manufacturing company. They developed software that could read the census information. Why might this be controversial?
Canadian privacy. Lots of personal data collected by American company. • Canadian sovereignty. Lockheed Martin would be required to turn over any of its info to the US gov’t if it asked. • Canadian jobs lost to American company • Canadian jobs lost to American software
Here is the plan in a nutshell: Don't do the Census online, as StatsCanada encourages. Offer only minimum cooperation with the Census. Be creative. Make noise. Complain. Protest. Get others involved. (Count Me Out)
How often do we have a census in Canada? 4. every ten years (major) and less detailed one every five years Why is census data sometimes inaccurate? • homeless not counted • people unwilling to fill out forms 5. developing countries:registration of births/deaths not complete,remote areas, shantytowns, not counted,people avoid authorities
Terms to know: • Developed country: highly developed economy, strong service sector and industrial base. High standards of living, literacy, health, and food supplies. (Rich country) • Developing country: economy that depends more on primary industries (export of natural resources). Lower standard of living. (Poor country) • Emigration: people moving out of a country • Immigration: people moving into a country • Migration: people moving from one area to another for a duration of time
Population Rates 7. What are the components of population change? · how many people born · how many die · how many move in/out of an area 8. How are these expressed in an equation? • Births – deaths + immigrants – emigrants = increase or decrease in population
Divide the number of births in one year by the population and then multiply by 1000. We do this because it is easier to compare countries with different size populations. • In the example above: 100 divided by 1 000 000 = .00001 times 1000 equals a birth rate of .1 (very low!) • Same method is used for the death rate. To find the natural increase/decrease, you simply subtract the deaths from births. Practice: look at the graph on page 320. Which country has the highest birth rate?
Natural increase or decrease • Births + or – deaths : natural increase or decrease. • Ex: if a country has 1 000 000 people and in one year 100 were born and 80 died, the natural increase was 20 people. • It is better expressed via crude birth rates and death rates per 1000 people.
2002/2003 2003/2004 2004/2005 2005/2006r 2006/2007p birth rate per 1,000 population Canada 10.5 10.6 10.6 10.6 10.8 Newfoundland and Labrador 8.9 8.9 8.8 8.7 8.5 Prince Edward Island 10.0 10.2 9.9 9.7 9.8 Nova Scotia 9.2 9.3 9.2 9.1 9.0 New Brunswick 9.5 9.4 9.1 9.1 9.0 Quebec 9.7 9.9 10.0 10.3 10.9 Ontario 10.6 10.8 10.6 10.6 10.6 Manitoba 11.9 12.0 12.0 12.0 12.0 Saskatchewan 11.8 12.2 12.0 12.1 12.1 Alberta 12.6 12.8 12.7 12.9 13.3 British Columbia 9.8 9.6 9.6 9.6 9.8 Yukon Territory 10.6 12.2 11.0 10.2 10.0 Northwest Territories 15.7 16.4 16.5 16.4 16.0 Nunavut 26.3 24.7 24.2 23.5 24.1 p : preliminary.r : revised.Note: From July 1 of one year to June 30 of the next year.Source: Statistics Canada, CANSIM, tables (for fee) 051-0001 and 051-0004, and Catalogue no. 91-213-X.Last modified: 2007-11-29.
2002/2003 2003/2004 2004/2005 2005/2006r 2006/2007p number of births Canada 330,523 337,762 339,270 345,355 352,848 Newfoundland and Labrador 4,596 4,598 4,543 4,443 4,326 Prince Edward Island 1,374 1,403 1,371 1,343 1,348 Nova Scotia 8,635 8,713 8,575 8,499 8,382 New Brunswick 7,104 7,072 6,874 6,840 6,728 Quebec 72,273 74,364 75,422 78,471 83,150 Ontario 129,256 132,874 132,796 133,961 134,141 Manitoba 13,765 13,981 14,031 14,136 14,166 Saskatchewan 11,794 12,121 11,915 11,925 11,918 Alberta 39,450 40,635 41,345 42,875 44,661 British Columbia 40,534 40,205 40,631 41,135 42,306 Yukon Territory 322 374 340 319 311 Northwest Territories 658 697 705 699 678 Nunavut 762 725 722 709 733 p : preliminary.r : revised.Note: From July 1 of one year to June 30 of the next year.Source: Statistics Canada, CANSIM, table (for fee) 051-0004 and Catalogue no. 91-213-X.Last modified: 2007-09-27. Number of births
Doubling time: The Rule of Seventy 9. exponential rates of increase in population. • each generation builds upon the previous one, so that populations grow exponentially as each generation doubles in size. • the rule of seventy is the idea that each generation of children builds on previous generations in a compound fashion. • to figure out how long it takes a country to double its population, 70 divided by percent growth per year = doubling time
The Effect of Migrations • Population increase in some countries depends on immigration. • Immigration and emigration rates are calculated in a similar way to death and birth rates. (people into or out of country divided by population and multiplied by 1000) • The difference between immigration rates and emigration rates gives us the net migration rate.
Population Growth Rate • This tells us the total growth in population of a country • Birth Rate – Death Rate +/- Net Migration Rate = Population growth rate.
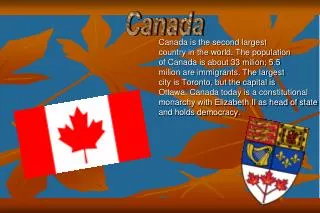
Immigration is a significant factor in the growth of Canada’s population 10. What 2 reasons are given for immigrants coming to Canada? • economic migrants wishing to better standard of living • refugees seeking escape from persecution • What about your family?
Large-scale mass migrations can significantly affect the structure of a population • Most are young, often male, which eventually results in a high birth rate • The country losing population experiences the opposite effect 11. Before the Berlin Wall was built, many young people fled to West Germany, leaving East Germany with an unusually high proportion of older people
The Demographic Revolution • Terms to know:Life expectancy: average number of years one is expected to liveDemographic transition model: (DTM) describes population changes over time. It is based on an interpretation begun in 1929 by the American demographer Warren Thompson of prior observed changes, or transitions, in birth and death rates in industrialized societies over the past two hundred years.
23 Why did the world population grow slowly for most of our history? -death rates very high, particularly for children -short life expectancy in the 1700’s - a little over 30 years – in Canada today it is nearing 81 ~ Thomas Hobbes described life for most as "solitary, poor, nasty, brutish, and short” in 1651
4. What factors contributed to a high death rate? • poor medical care, sanitation, disease, poor nutrition 5. Why did most people have large families? • families had many children in hopes they would survive and to farm the land and provide for older parents • This is still common in some developing countries
6. What factors led to a rapid decline in the death rate after 1750? · increased food production = better diets · hygiene/medical knowledge improved · clean drinking water • more varied and nutritious diet · vaccinations
7. What are possible reasons for recent declines in birth rates for industrialized countries? • economic development • move to cities • rising standards of living • women’s education and rights 8. Why do you think the birth rates might be high in many developing countries?
Why do you think birthrates might be high in developing countries? • Little education about birth control • Women are not always in control of their reproduction – Do not/will not/can not say no to their husbands • Need children to help on the farm • Need children to take care of parents in old age
9. What might be some problems or concerns for countries with: a. A very high birth rate • insufficient medical care for new babies, high infant mortality • Insufficient funds for education b. A very low birth rate • shortage of workers and entrepreneurs unless immigrants are taken • Fewer young people to care for an aging population
Demographic Transition Model • Examine the DTM on page 366. Summarize the stages of the Model. • Stage 1: high birth and death rates, small population growth. • Stage 2: better health, sanitation, increased food leads to fall in death rates. Birth rates remain high = increase in population. • Stage 3:growth declines. Birth rates drop. Industrialization, urbanization, living standards = less desire for large families. • Stage 4:low growth. Low birth and death rates. Occasional fluctuations. • Stage 5: birth rates drop below death rates. Population declines.
The Age Structure of Populations (325) • Why do demographers like to study the age structures of populations? • Helps us understand reasons for change • What ages are populations divided into? • Under fifteen, 16-64, 65 and over. • 35 What is ‘dependency ratio’? • Proportion of population supported by workers.
What pressure do children and the elderly put on society? medical, education, housing, other services
Population Terms page 325 Population pyramid: graph that shows the age and sex structure of a population Cohorts: age intervals of five years in a pyramid, separated by sex
Why are these pyramids useful? • Easier to see the structure of a population • Comparing structures of different countries • Identify: • expanding population: high birth rates • Stable population: birth rates and death rates in balance • Contracting population: growth rate below replacement level
Look at the population pyramids on page 371 & 372. 2. What problems might Japan face based on the age structure of its population? • how to support the middle aged people when they reach older years