Download
1 / 17
170 likes | 292 Views
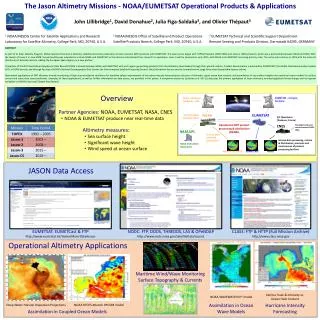
Ocean Surface Winds. NOAA C oast W atch Program DOC/NOAA/NESDIS/STAR/SOCD College Park, MD 20740 http://coastwatch.noaa.gov. In this Lesson:. Why do we measure ocean surface winds? What are ocean surface winds? How are they measured? How do they develop? What are vectors?

E N D
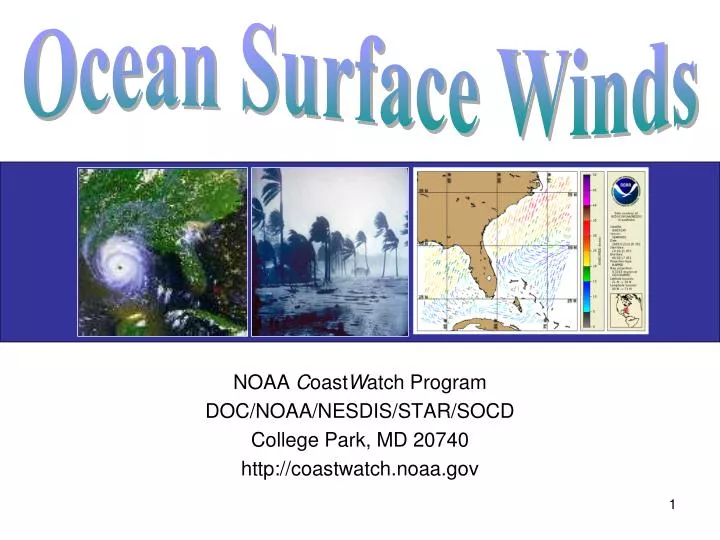
Ocean Surface Winds NOAA CoastWatch Program DOC/NOAA/NESDIS/STAR/SOCD College Park, MD 20740 http://coastwatch.noaa.gov
In this Lesson: • Why do we measure ocean surface winds? • What are ocean surface winds? • How are they measured? • How do they develop? • What are vectors? • How do you read a vector?
Ocean Surface Winds • Wind is the horizontal motion of air relative to the earth’s surface. • Ocean surface wind is wind at or near the ocean surface. • Unequal heating across the earth’s surface by the sun results in differences in air pressure. • Ocean surface winds develop when this difference in pressure produces a force (called the pressure gradient force) that causes the air to move from the area of high pressure towards the area of low pressure. (The stronger the pressure difference, the stronger the wind will be.) Sea Level Pressure Nov to Mar 1999-2002 Wind Anomaly Composite
WIND L H Ocean Surface Winds H L 3 1 2 PRESSURE GRADIENT FORCE • (1)The WARM ocean surface heats the air above it. This warm air rises creating an area of low pressure (2). As it cools, the air collects, increasing pressure and creating an area of high pressure (3). • Because of unequal heating by the sun across the surface, the result yields differences in air pressure. The atmosphere tries to re-establish equal pressure, forcing the air to move from the area of high pressure towards the area of low pressure.
Why do we Measure? With instruments aboard satellites, we can measure both wind speed and direction. The data collected help meteorologists more accurately predict the winds and waves that affect everyday human life. Storm Detection: Satellites give the big picture to determine the location, direction, and size of storms at sea. (i.e. hurricanes as they form) Weather Forecasting: The data is used for timely, accurate weather forecasting.
Why do we Measure? Ship Routing: Knowing what the ocean winds are doing helps ship Captains to choose appropriate routes to avoid heavy seas. Environmental Impact: In the event of an oil spill, surface-wind information is key to determining how and where the oil will spread. What are other examples that require monitoring ocean surface winds?
How do we Measure? • Scientists measure both the wind speed (how fast the air is moving relative to the earth’s surface) and wind direction (the direction the air is coming from): • An anemometer is used to measure the speed of the wind, while a wind vane detects the direction of the wind. These instruments are placed on: • Sea-going ships to measure as they travel across the ocean. • Drifting and stationary buoys at various locations throughout the ocean.
How do we Measure? • Ocean surface winds can also be measured “remotely” by using special instruments flown onboard aircraft and satellites: • Although scientists have an understanding of winds, globally, individual events like hurricanes, need further studies. Therefore, scientists fly through hurricanes and winter storms in airplanes to retrieve near-real-time measurements for a better understanding. • Satellites can cover large regions of the entire globe in a short amount of time. The path a satellite travels is called its orbit. The area on the earth’s surface that the satellite flies over is referred to as the satellite swath. What is the advantage of measuring winds with a satellite versus a buoy?
Wind speed scale (knots) In this satellite image, you see cloud formations with wind data from 3 buoys (see the red arrows). With ships and buoys, the wind data are only for that specific location. With this image, can you determine the wind speed at the star? This is a satellite image showing wind vectors. Would you be able to determine the wind speed at the star, now? With satellite imagery, wind measurements are available for a large area.
Wind Vectors…Magnitude Ocean surface winds can be depicted with vector symbols. Vectors indicate the magnitude (how much) and direction (from where it is coming). Magnitude… The O symbol represents zero knots. The short bar represents 5 knots. The long bar represents 10 knots. Symbols can be added to the stem for higher winds speeds. After 4 long bars and 1 short bar the flag is used to represent 50 knots.
Wind Vectors…Direction Direction… The direction of the main stem of the vector shows the degree the wind is coming from using north as a zero degree reference point. Note: Vectors are depicted in knots, which is 1 nautical mile per hour.
Vector Examples 60 knots from 020° (from the north-northeast) 15 knots from 315° (from the northwest) 40 knots from 090° (from the east) Vector Practice Estimate the magnitude and direction of the wind vector using degrees and compass directions.
Questions How are ocean surface winds created? How do scientists measure ocean surface winds? Why would you measure ocean surface winds? What does a vector tell you? What is a “knot” and how does it compare to “miles per hour”?
Vocabulary Wind Ocean Surface Wind Pressure gradient force Speed Direction Anemometer Wind vane Orbit Swath Knots JD UTC Vectors Magnitude
BONUS: A global image of ocean surface winds can show patterns. Notice in the southern hemisphere the winds are very strong. Why do you think this is? ___________________________________________________________________ Notice the strong winds in the Arctic that correspond with winter storms in the North Atlantic and Bering Seas. What are the vertical white gaps near the equator? ______________________________
Thank you for taking the time to review this tutorial. Please forward any comments and suggestions to coastwatch.info@noaa.gov For more information on CoastWatch, please visit the website at http://coastwatch.noaa.gov