Download
1 / 1
10 likes | 134 Views
A Rare Case of One Single Sine Wave Dominating the Westward Propagation of Altimetric Sea Level Over an Extended Region a nd Prolonged Period. C.-K. Tai 1 (GOVERNMENT PRINCIPAL INVESTIGATOR) 1 NOAA/NESDIS/STAR/SOCD. Requirement: Understand Climate Variability and Predict Earth’s Environment

E N D
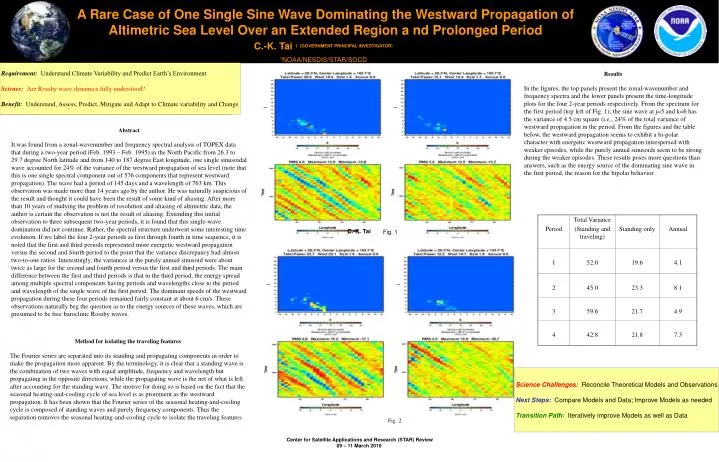
A Rare Case of One Single Sine Wave Dominating the Westward Propagation of Altimetric Sea Level Over an Extended Region a nd Prolonged Period C.-K. Tai 1 (GOVERNMENT PRINCIPAL INVESTIGATOR) 1NOAA/NESDIS/STAR/SOCD Requirement: Understand Climate Variability and Predict Earth’s Environment Science:AreRossby wave dynamics fully understood? Benefit: Understand, Assess, Predict, Mitigate and Adapt to Climate variability and Change Requirement: Abcdefg hijkl … Science:Mnopqr … Benefit: Stuvw xyz Results In the figures, the top panels present the zonal-wavenumber and frequency spectra and the lower panels present the time-longitude plots for the four 2-year periods respectively. From the spectrum for the first period (top left of Fig. 1), the sine wave at j=5 and k=6 has the variance of 4.5 cm square (i.e., 24% of the total variance of westward propagation in the period. From the figures and the table below, the westward propagation seems to exhibit a bi-polar character with energetic westward propagation interspersed with weaker episodes, while the purely annual sinusoids seem to be strong during the weaker episodes. These results poses more questions than answers, such as the energy source of the dominating sine wave in the first period, the reason for the bipolar behavior. Abstract It was found from a zonal-wavenumber and frequency spectral analysis of TOPEX data that during a two-year period (Feb. 1993 – Feb. 1995) in the North Pacific from 26.3 to 29.7 degree North latitude and from 140 to 187 degree East longitude, one single sinusoidal wave accounted for 24% of the variance of the westward propagation of sea level (note that this is one single spectral component out of 576 components that represent westward propagation). The wave had a period of 145 days and a wavelength of 763 km. This observation was made more than 14 years ago by the author. He was naturally suspicious of the result and thought it could have been the result of some kind of aliasing. After more than 10 years of studying the problem of resolution and aliasing of altimetric data, the author is certain the observation is not the result of aliasing. Extending this initial observation to three subsequent two-year periods, it is found that this single-wave domination did not continue. Rather, the spectral structure underwent some interesting time evolution. If we label the four 2-year periods as first through fourth in time sequence, it is noted that the first and third periods represented more energetic westward propagation versus the second and fourth period to the point that the variance discrepancy had almost two-to-one ratios. Interestingly, the variances at the purely annual sinusoid were about twice as large for the second and fourth period versus the first and third periods. The main difference between the first and third periods is that in the third period, the energy spread among multiple spectral components having periods and wavelengths close to the period and wavelength of the single wave of the first period. The dominant speeds of the westward propagation during these four periods remained fairly constant at about 6 cm/s. These observations naturally beg the question as to the energy sources of these waves, which are presumed to be free baroclinic Rossby waves. C.-K. Tai Fig. 1 Method for isolating the traveling features The Fourier series are separated into its standing and propagating components in order to make the propagation more apparent. By the terminology, it is clear that a standing wave is the combination of two waves with equal amplitude, frequency and wavelength but propagating in the opposite directions, while the propagating wave is the net of what is left after accounting for the standing wave. The motive for doing so is based on the fact that the seasonal heating-and-cooling cycle of sea level is as prominent as the westward propagation. It has been shown that the Fourier series of the seasonal heating-and-cooling cycle is composed of standing waves and purely frequency components. Thus the separation removes the seasonal heating-and-cooling cycle to isolate the traveling features. Science Challenges: Reconcile Theoretical Models and Observations Next Steps:Compare Models and Data; Improve Models as needed Transition Path: Iteratively improve Models as well as Data Fig. 2