Download

1 / 19
200 likes | 341 Views
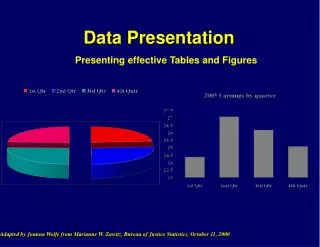
Data Presentation. Synopticity Data presentation Living with earthquakes/hazard perception Different impacts across the city and amongst different people Relocating and rebuilding Changing urban geography in CBD and suburbs Preparing for the next one Monitoring and prediction

E N D
Synopticity • Data presentation • Living with earthquakes/hazard perception • Different impacts across the city and amongst different people • Relocating and rebuilding • Changing urban geography in CBD and suburbs • Preparing for the next one • Monitoring and prediction • GIS and public awareness • Plate movements and landscape intepretation
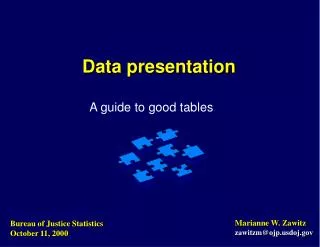
Data Manipulation AQA say • You should also think about ways of manipulating data; looking at proportions, percentage changes etc. (has anything doubled/ tripled/halved?) • However, you must beware of ‘data waffle’ – describing masses of data rather than actually utilising it. • The key as always is to look for trends, choose one or two pieces of data to illustrate the point (but not too many) and identify any anomalies that may be apparent.
• You should also think about ways of manipulating data; looking at proportions, percentage changes etc. (has anything doubled/ tripled/halved?) • However, you must beware of ‘data waffle’ – describing masses of data rather than actually utilising it. • The key as always is to look for trends, choose one or two pieces of data to illustrate the point (but not too many) and identify any anomalies that may be apparent. AQA says….You may be asked questions involving: • Data presentation – eg the interpretation of choroplethmaps • Data description – eg summary of characteristics, differences in sets of data • Data analysis – use of statistical techniques.
• You should also think about ways of manipulating data; looking at proportions, percentage changes etc. (has anything doubled/ tripled/halved?) • However, you must beware of ‘data waffle’ – describing masses of data rather than actually utilising it. • The key as always is to look for trends, choose one or two pieces of data to illustrate the point (but not too many) and identify any anomalies that may be apparent. AQA says….You may be asked questions involving: • Data presentation – eg the interpretation of choroplethmaps • Data description – eg summary of characteristics, differences in sets of data • Data analysis – use of statistical techniques.
AQA says….You may be asked questions involving: • Data presentation – eg the interpretation of choroplethmaps • Data description – eg summary of characteristics, differences in sets of data • Data analysis – use of statistical techniques.
The Richter magnitude scale (often shortened to Richter scale) was developed to assign a single number to quantify the energy released during an earthquake. The scale is a base-10 logarithmic scale. The magnitude is defined as the logarithm of the ratio of the amplitude of waves measured by a seismograph to an arbitrary small amplitude. An earthquake that measures 5.0 on the Richter scale has a shaking amplitude 10 times larger than one that measures 4.0, and corresponds to a 31.6 times larger release of energy.[1] Since the mid-20th century, the use of the Richter magnitude scale has largely been supplanted by the moment magnitude scale in many countries. Also worth noting is that earthquake measurements under the moment magnitude scale in the United States—3.5 and up, on the MMS scale—are still usually erroneously referred to as being measured under the Richter scale in the general public, as well as the media, due to the familiarity with earthquakes being measured by the Richter scale instead of the MMS scale. The moment magnitude scale (abbreviated as MMS; denoted as MW or M) is used by seismologists to measure the size of earthquakes in terms of the energy released.[1]The magnitude is based on the seismic moment of the earthquake, which is equal to the rigidity of the Earth multiplied by the average amount of slip on the fault and the size of the area that slipped.[2] The scale was developed in the 1970s to succeed the 1930s-era Richter magnitude scale (ML). Even though the formulae are different, the new scale retains the familiar continuum of magnitude values defined by the older one. The MMS is now the scale used to estimate magnitudes for all modern large earthquakes by the United States Geological Survey.[3]
• You should also think about ways of manipulating data; looking at proportions, percentage changes etc. (has anything doubled/ tripled/halved?) • However, you must beware of ‘data waffle’ – describing masses of data rather than actually utilising it. • The key as always is to look for trends, choose one or two pieces of data to illustrate the point (but not too many) and identify any anomalies that may be apparent. AQA says….You may be asked questions involving: • Data presentation – eg the interpretation of choroplethmaps • Data description – eg summary of characteristics, differences in sets of data • Data analysis – use of statistical techniques.
• You should also think about ways of manipulating data; looking at proportions, percentage changes etc. (has anything doubled/ tripled/halved?) • However, you must beware of ‘data waffle’ – describing masses of data rather than actually utilising it. • The key as always is to look for trends, choose one or two pieces of data to illustrate the point (but not too many) and identify any anomalies that may be apparent. AQA says….You may be asked questions involving: • Data presentation – eg the interpretation of choroplethmaps • Data description – eg summary of characteristics, differences in sets of data • Data analysis – use of statistical techniques.
• You should also think about ways of manipulating data; looking at proportions, percentage changes etc. (has anything doubled/ tripled/halved?) • However, you must beware of ‘data waffle’ – describing masses of data rather than actually utilising it. • The key as always is to look for trends, choose one or two pieces of data to illustrate the point (but not too many) and identify any anomalies that may be apparent. AQA says….You may be asked questions involving: • Data presentation – eg the interpretation of choroplethmaps • Data description – eg summary of characteristics, differences in sets of data • Data analysis – use of statistical techniques.
Ave no of 7+ earthquakes (USGS) = 16 Ave annual energy released by earthquake activity = 320 PJ Ave energy released per earthquake???? = __________ PJ’s
• You should also think about ways of manipulating data; looking at proportions, percentage changes etc. (has anything doubled/ tripled/halved?) • However, you must beware of ‘data waffle’ – describing masses of data rather than actually utilising it. • The key as always is to look for trends, choose one or two pieces of data to illustrate the point (but not too many) and identify any anomalies that may be apparent. 20 PJ’s global average? AQA says….You may be asked questions involving: • Data presentation – eg the interpretation of choroplethmaps • Data description – eg summary of characteristics, differences in sets of data • Data analysis – use of statistical techniques.
• You should also think about ways of manipulating data; looking at proportions, percentage changes etc. (has anything doubled/ tripled/halved?) • However, you must beware of ‘data waffle’ – describing masses of data rather than actually utilising it. • The key as always is to look for trends, choose one or two pieces of data to illustrate the point (but not too many) and identify any anomalies that may be apparent. AQA says….You may be asked questions involving: • Data presentation – eg the interpretation of choroplethmaps • Data description – eg summary of characteristics, differences in sets of data • Data analysis – use of statistical techniques.
AQA say…….Use of the Internet • This can be very useful from the point of view of researching relevant material and getting a ‘feel’ for the topic and location. • In some cases, the AIB itself acknowledges various internet sites and these are well worth looking into. You may even be directed to certain websites. • However, you should be careful that you are not drawn into extensive research of complex sites which may have marginal relevance or may provide biased points of view. Item 6 a. Familiarise yourselves with these websites b. How good are the first two websites in conveying information and advice? What is particularly effective?
Item 6 a. Familiarise yourselves with these websites b. How good are the first two websites in conveying information and advice? What is particularly effective?
Item 6 a. Familiarise yourselves with these websites b. How good are the first two websites in conveying information and advice? What is particularly effective? Long term predictions web site
Item 6 a. Familiarise yourselves with these websites b. How good are the first two websites in conveying information and advice? What is particularly effective? Long term predictions web site
• You should also think about ways of manipulating data; looking at proportions, percentage changes etc. (has anything doubled/ tripled/halved?) • However, you must beware of ‘data waffle’ – describing masses of data rather than actually utilising it. • The key as always is to look for trends, choose one or two pieces of data to illustrate the point (but not too many) and identify any anomalies that may be apparent. AQA says….You may be asked questions involving: • Data presentation – eg the interpretation of choroplethmaps • Data description – eg summary of characteristics, differences in sets of data • Data analysis – use of statistical techniques.