Download
1 / 21
210 likes | 398 Views
DEMOGRAPHIC TRANSITION AND ECONOMIC DEVELOPMENT AT THE LOCAL LEVEL IN BRAZIL. Ernesto F. L. Amaral Advisor: Dr. Joseph E. Potter Population Research Center University of Texas at Austin. Background: Demographic Dividend.

E N D
DEMOGRAPHIC TRANSITIONAND ECONOMIC DEVELOPMENTAT THE LOCAL LEVEL IN BRAZIL Ernesto F. L. Amaral Advisor: Dr. Joseph E. Potter Population Research Center University of Texas at Austin
Background: Demographic Dividend • Long, controversial, and still unresolved debate about population growth and economic development. • Bloom, Williamson, Mason and others indicate that taking age distribution into account matters. • Looking at Asian countries through time, they found that economic development was associated with the decline of dependency ratio. • The same demographic shifts that took place in Asia are now taking place in Latin America, and in Brazil in particular.
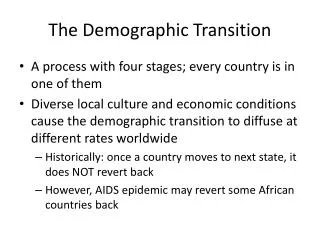
Demographic and Educational Transitions in Brazil • Since the 1960s Brazilian fertility has declined sharply, with a consequent reduction of the population growth rate, as well as a change in age structure through time. • Differences in the timing and speed of the fertility transition led to substantial differences in age distribution across states and municipalities at different points in time. • During the same period, enrollment in primary and secondary schools increased substantially from very low levels, but with much regional variation.
Modeling Strategies • We could look at three different sets of outcomes: • Enrollment in school or university. • Aggregate measures of income per capita. • Labor force outcomes including employment in the formal or informal sector and wage earnings.
“Baby Boom” and Labor Market • Cohorts born during the “baby boom” entered the American labor market between the end of the 1960s and the middle of the 1970s. • Freeman (1979) and Welch (1979) concluded that “baby boomers” had lower income at the beginning of their career than older workers. • Triest, Sapozhnikov and Sass (2006) indicated that “baby boomers” will still affect income structure after their retirement. • For Brazil and Mexico, Daniel Hamermesh proposed models to estimate the impact of changing age-education composition in the income of workers.
Data • Microdata from the 1960-2000 Brazilian Censuses. • Census long forms are available for 25% (1960, 1970 and 1980) and 10% or 20% (1991 and 2000) of households. • Long forms contain information on age, sex, education, income, occupation, and migration. • Municipalities are aggregated to the microregion level, yielding 502 comparable areas across the five censuses.
Categories • Time refers to 1970, 1980, 1991, and 2000. • Age is categorized in four groups: • Youth population (15-24). • Young adults (25-34). • Adults (35-49). • Mature adults (50-64). • Education attainment was classified in three groups: • Illiterate people (0) and people in the first phase of elementary school (1-4). • Second phase of elementary school (5-8). • Secondary school (9-11) and some college (12+).
NO NO NO NO NE NE NE NE SE SE SE SE SO SO SO SO CW CW CW CW Percent of Men with 25-34 Years of Ageand 9+ Years of Schooling in 502 Brazilian Microregions,1970-2000 Censuses 1970 1980 1991 2000
NO NO NO NO NE NE NE NE SE SE SE SE SO SO SO SO CW CW CW CW Percent of Men with 35-49 Years of Ageand 0-4 Years of Schooling in 502 Brazilian Microregions,1970-2000 Censuses 1970 1980 1991 2000
Changes in the Male Age Distributionin Selected Brazilian Microregions,1970 and 2000 Censuses NORTHEAST SOUTHEAST 1970≈2000 1970 ≠ 2000 NORTHEAST SOUTH 1970≈2000 1970 ≠ 2000
Changes in the Male Education Distributionin Selected Brazilian Microregions,1970 and 2000 Censuses NORTHEAST SOUTHEAST 19702000 19702000 NORTHEAST SOUTH 19702000 19702000
Estimation of Models • Fixed-effects models allow the estimation of coefficients that reflect relationships within microregions over time on labor outcomes. • We start with the logarithm of the mean nominal income in a group. • Areas with less than 25 people receiving income were not included in the regression. • For now, results were generated without weights. • Regressions only include males.
Equation 1 • EQUATION 1: within each area (i), at each time (t), we have averages of income predicted by the proportion of people for each one of the age-education cells (c). Giving 12 regressions of the following form: Witc = β0 + β1Xitc + υi + θt + εitc , i = 1…K; t = 1…T • POOLED OF EQUATION 1: one single regression, including 3 dummies for year, 11 dummies for age-education groups, and 12 proportions of people in each one of the age-education groups. • See how the data looks in the following slide...
15-24 years 25-34 years 35-49 years 50-64 years Exponentials of Effects of Age-Education Group Dummiesin the Logarithm of the Monthly Nominal Income: Brazil, 1970-2000
-0.1 15-24 years 25-34 years 35-49 years 50-64 years Percent Reduction in the Logarithm of the Monthly Nominal Incomeas a Result of One-Percent Change of People in Age-Education GroupsBrazil, 1970-2000 (ns) (ns)
Predicted Mean Monthly Nominal Income by Proportion of People in 502 Brazilian Microregions, 1970-2000 1970 1980 Young adults (25-34) 9+ years of schooling Adults (35-49) 0-4 years of schooling 1991 2000
Equation 1’ • EQUATION 1’: equals Equation 1, adding interactions of proportion of people in age-education group with 3 dummies for year. Witc = β0 + β1Xitc + β3θtXitc + υi + θt + εitc , i = 1…K; t = 1…T • POOLED OF EQUATION 1’: one single regression, including 3 dummies for year, 11 dummies of age-education groups, 12 proportions of people in each one of the age-education groups, and interactions of those proportions with 3 time dummies (12x3=36 coefficients). • In general, results indicate that negative impacts of proportions of people on income reduced across years.
Internal Migration • The use of a smaller unit of analysis (microregion) makes it important to account for internal migration in the estimation of models. • Main migration streams are from areas of higher fertility rates to those of lower fertility, which might reduce the differential in birth rates between areas. • However, migration might also increase the difference in dependency ratios since migrants are concentrated in the working ages. • And, of course, migration responds to differences in wages.
Migration Variables • Available in 1960-2000 Brazilian Censuses: • State or country of birth. • State or country of previous residence. • Number of years of residency in the municipality. • Greenwood and Sweetland (1972) used aggregate proxy variables that are likely to enter into the decision of migrate. • Borjas (2003) measures the impact of immigrant share variable on labor market outcomes of native workers. • Since internal migration in Brazil is influenced by availability of jobs and levels of income, it could not be simply introduced as an exogenous variable.
Future Activities • Run more complex models, including effects of how proportions of people in each one of the age-education groups influence the income of people in other age-education groups. • Figure out how to use migration information, and model migration. • Incorporate women in the models. • Adapt income information in 1960 Census. • In Mexico, not only income matters, but also informal sector, since 30% of labor force has critical occupation conditions (Alba et al. 2006).