Download
1 / 12
120 likes | 306 Views
The Demographic Transition. A process with four stages; every country is in one of them Diverse local culture and economic conditions cause the demographic transition to diffuse at different rates worldwide Historically: once a country moves to next state, it does NOT revert back

E N D
The Demographic Transition • A process with four stages; every country is in one of them • Diverse local culture and economic conditions cause the demographic transition to diffuse at different rates worldwide • Historically: once a country moves to next state, it does NOT revert back • However, AIDS epidemic may revert some African countries back
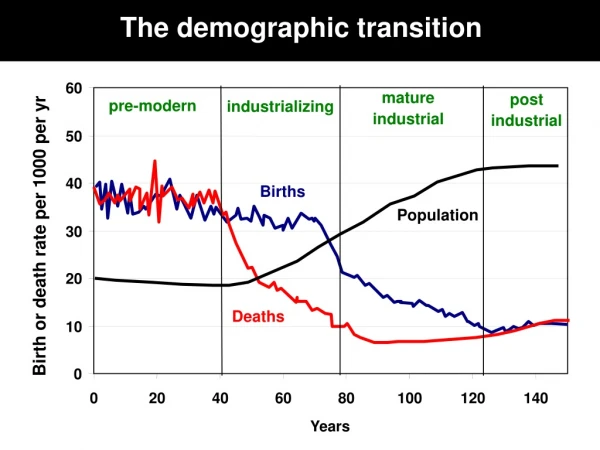
Stage 1: Low Growth • Very high birth and death rates produce virtually no long-term natural increase • People depended on hunting and gathering • Despite Agricultural Revolution, world remained in Stage 1 b/c food supplies were still unpredictable • Agricultural Revolution – time when human beings first domesticated plants and animals; they no longer depended on hunting and gathering
Stage 2: High Growth • Consists of rapidly declining death rates with very high birth rates which in turn cause a very high NIR • Most countries entered Stage 2 around 1750-1800 as a result of the Industrial Revolution • Later, LDCs of Africa, Asia, and Latin America entered Stage 2 following the Medical Revolution • Overall, Stage 2 countries have higher population and lower CDR than they did in Stage 1; usually advanced technology and better medical equipment
Stage 3: Moderate Growth • Population is evening out from Stage 2 • Population goes thru a demographic transition where CBR drops dramatically; but pop continues to increase because CBR > CDR • Economic Changes: people work mostly in urban areas so children are not needed for economic support as they were 100 yrs ago • Urban homes smaller; don’t support large families
Stage 4: Low Growth • When the CDR equals the CBR and the population gets to zero population growth (ZPG) • The end of the cycle • Stage 4 has the same NIR as Stage 1 • Precursor to the theorized Stage 5 • The most advanced Stage
Population Pyramids • Pop Pyramid – bar graph representing distribution of a pop by age and sex 1) Age: length of bar represents % of pop in that age group (generally 5 year increments) 2) Sex: Males left; Females right * Shape f pyramid is determined primarily by the CBR in the society • Each Stage (DTT) has a distinctive population structure
Age Distribution • How different age groups in an area affects the country’s productivity • 3 Age Groups: 1) 0 – 14 (dependents) 2) 15 – 64 (workforce) 3) 65+ (dependents) • Dependency Ratio - # of people too young or old to work compared to the # of productive people • Evens out as countries reach stages 3 & 4 ( CBRs) • Ex. ½ of people in Stage 2 are dependents; 1/3 in Stage 4
Sex Ratio • Number of males per 100 females • Ex. 93:100 (Europe); 97:100 (NA); 103:100 (LDCs) • Slightly more males are being born, BUT have higher death rates • Young men generally outnumber young women; old women outnumber old men • Use Pop Pyramids to study regions—can make inferences about the special features demographics
Cape Verde: Stage 2 • 1st half of 20th Century the pop declined • CBR was in 40s; CDR in 20s • Gap produced high NIR typical of Stage 2, BUT still in Stage 1 due to famines • In 1950, anti-malarial campaign launched that moved Cape Verde to Stage 2 • Pop has grown • NIR > 2% • CDR dropped dramatically • CBR still high; fluctuates due to famines
Chile: Stage 3 • Thru recent decades moved from rural society, based on agriculture, to an urban society, where employment consists of jobs in factories, offices, and shops • Regardless, Chileans still have large families • Majority of growth due to immigration • 1960s – vigorous gov family-planning policy; reduced incomes and high unemployment moved Chile to Stage 3 • Move to Stage 4 is restricted by majority of Chileans being Roman Catholic—oppose artificial birth-control
Denmark: Stage 4 • Living longer • Death rates higher b/c of the higher pop of elders • Medical advancements may create a decline in death rates
Demographic Transition and World Population Growth • Demographic Transition – 2 big breaks in past: 1st – Sudden drop in death rate resulting from technological advancements 2nd – Sudden drop in in birth rates that comes from social customs (not in many countries) • Stage 1 – No country remains here • Stage 2 – High growth, deaths more controlled • Stage 3 – Medium growth, deaths and births controlled • Stage 4 – Low growth, stable all-around births and deaths; higher total pop • Demographic Transition – Process of change in a society’s pop