Download
1 / 34
360 likes | 569 Views
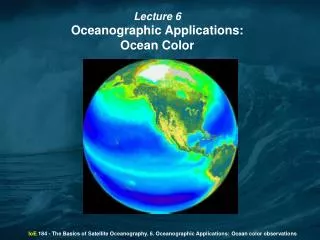
Lecture 10: Ocean Carbonate Chemistry: Ocean Distributions Ocean Distributions Controls on Distributions. What is the distribution of CO 2 added to the ocean?. See Section 4.4 Emerson and Hedges. Sarmiento and Gruber (2002) Sinks for Anthropogenic Carbon

E N D
Lecture 10: Ocean Carbonate Chemistry: Ocean Distributions Ocean Distributions Controls on Distributions What is the distribution of CO2 added to the ocean? See Section 4.4 Emerson and Hedges
Sarmiento and Gruber (2002) Sinks for Anthropogenic Carbon Physics Today August 2002 30-36
CO2 + rocks = HCO3- + clays CO2 River Flux Gas Exchange Atm Ocn CO2→ H2CO3→ HCO3- → CO32- Upwelling/ Mixing + H2O = CH2O + O2 + Ca2+ = CaCO3 CO2 BorgC BCaCO3 Biological Pump Controls: pH of ocean Sediment diagenesis
Influences on pCO2 Ko: Solubility of CO2 K1, K2: Dissociation constants Function of Temperature, Salinity Depends on biology and gas exchange Depends on biology only
Ocean Distributions – versus depth, versus ocean Atlantic Pacific Points: 1. Uniform surface concentrations 2. Surface depletion - Deep enrichment 3. DIC < Alk 4. DDIC > DAlk See Key et al (2004) GBC Q?
Controls on Ocean Distributions A) Photosynthesis/Respiration Organic matter (approximated as CH2O for this example) is produced and consumed as follows: CH2O + O2 CO2 + H2O Then: CO2 + H2O H2CO3* H2CO3* H+ + HCO3- HCO3- H+ + CO32- As CO2 is produced during respiration we should observe: pH DIC Alk PCO2 The trends will be the opposite for photosynthesis. B) CaCO3 dissolution/precipitation CaCO3(s) Ca2+ + CO3 2- Also written as: CaCO3(s) + CO2 + H2O Ca2+ + 2 HCO3- As CaCO3(s) dissolves, CO32- is added to solution. We should observe: pH DIC Alk PCO2
Influence of Nitrogen Uptake/Remineralization on Alkalinity NO3- assimilation by phytoplankton 106 CO2 + 138 H2O + 16 NO3-→ (CH2O)106(NH3)16 + 16 OH- + 138 O2 NH4assimilation by phytoplankton 106 CO2 + 106 H2O + 16 NH4+→ (CH2O)106(NH3)16 + 16 H+ + 106 O2 NO3- uptake is balanced by OH- production Alk ↑ NH4+ uptake leads to H+ generation Alk ↓ Alk = HCO3- + 2 CO32- + OH- - H+ See Brewer and Goldman (1976) L&O Goldman and Brewer (1980) L&O Experimental Culture
Ocean Distributions of, DIC, Alk, O2 and PO4 versus Depth and Ocean The main features are: 1. uniform surface values 2. increase with depth 3. Deep ocean values increase from the Atlantic to the Pacific 4. DIC < Alk DDIC > DAlk 5. Profile of pH is similar in shape to O2. 6. Profile of PCO2 (not shown) mirrors O2.
Carbonate ion (CO32-) and pH decrease from Atlantic to Pacific x 10-3mol kg-1 x 10⁻⁶ mol kg-1 Alk DIC CO32- pH Surface Water 2.300 1.950 2468.12 North Atlantic 2.350 2.190 1287.75 Deep Water Antarctic 2.390 2.280 1017.63 Deep Water North Pacific 2.420 2.370 727.46 Deep water S = 35 T = 25C Deep Atlantic to Deep Pacific DAlk = 0.070 DDIC = 0.180 So DAlk/DDIC = 0.40 CO32- decreases from surface to deep Atlantic to deep Pacific. These CO32- are from CO2Sys. Can Approximate as CO32-≈ Alk - DIC Q? CO2Sys/CO2Calc
Ocean Alkalinity versus Total CO2 in the Ocean (Broecker and Peng, 1982)
DDIC/DAlk≈ 1.5/1 Work Backwards DAlk / DDIC ≈ 0.66 = 2/3 = 2 mol Org C / 1 mol CaCO3 Emerson and Hedges Color Plate
What is composition of sinking particles? Data from annual sediment traps deployments 5 g POC g m-2 y-1 / 12 g mol-1 = 0.42 mol C m-2 y-1 40 g CaCO3 g m-2 y-1 / 105 g mol-1 = 0.38 mol C m-2 y-1 Org C / CaCO3 ~ 1.1 From Klaas and Archer (2002) GBC
POC and CaCO3 Export Fluxes Based on Global Model results of Sarmiento et al (2992) GBC; Dunne et al (2007) GBC POC/CaCO3 = 9.6 / 0.52 = 18.5
Revelle Factor The Revelle buffer factor defines how much CO2 can be absorbed by homogeneous reaction with seawater. B = dPCO2/PCO2 / dDIC/ DIC B = CT / PCO2 (∂PCO2/∂CT)alk = CT (∂PCO2/∂H)alk PCO2 (∂CT/∂H)alk After substitution B ≈ CT / (H2CO3 + CO32-) For typical seawater with pH = 8, Alk = 10-2.7 and CT = 10-2.7 H2CO3 = 10-4.7 and CO32- = 10-3.8; then B = 11.2 Field data from GEOSECS Sundquist et al., Science (1979) dPCO2/PCO2 = B dDIC/DIC A value of 10 tells you that a change of 10% in atm CO2 is required to produce a 1% change in total CO2 content of seawater, By this mechanism the oceans can absorb about half of the increase in atmospheric CO2 B↑ as T↓ as CT↑
Revelle Factor Numerical Example (using CO2Sys) CO2 + CO32- = HCO3- 350ppm+ 10% = 385ppm CO2 Atm Ocn at constant alkalinity CO2→ H2CO3→ HCO3- → CO32- DIC 11.3 mM +1.2 (10.6%) 12.5 1640.5 mM +27.7 (1.7%) 1668.2 183.7 -11.1 (-6.0%) 174.2 1837 +17.9 (+0.97%) 1854.9 The total increase in DIC of +17.9 mM is mostly due to a big change in HCO3- (+27.7 mM) countering a decrease in CO32- (-11.1 mM). Most of the CO2 added to the ocean reacts with CO32- to make HCO3-. The final increase in H2CO3 is a small (+1.2 mM) portion of the total.
Effect of El Nino on ∆pCO2 fields High resolution pCO2 measurements in the Pacific since Eq. Pac-92 Eq Pac-92 process study PCO2sw Always greater than atmospheric Cosca et al. in press El Nino Index
Expression of Air -Sea CO2 Flux • Magnitude • Mechanism • Apply over larger space time domain k-transfer velocity From Sc # & wind speed S – Solubility From SST & Salinity F = k s (pCO2w- pCO2a) = K ∆ pCO2 pCO2a pCO2w From measurements and proxies From CMDL CCGG network
Global Map of Piston Velocity (k in m yr-1) times CO2 solubility (mol m-3) = K from satellite observations (Nightingale and Liss, 2004 from Boutin).
∆pCO2 fields Overall trends known: * Outgassing at low latitudes (e.g. equatorial) * Influx at high latitudes (e.g. circumpolar) * Spring blooms draw down pCO2 (N. Atl) * El Niños decrease efflux
JGOFS Gas Exchange Highlight #4 - ∆pCO2 fields:Takahashi climatology Monthly changes in pCO2w
Fluxes: JGOFS- Global monthly fluxes Combining pCO2 fields with k: F = k s (pCO2w- pCO2a) • On first order flux and ∆pCO2 maps do not look that different
CO2 Fluxes: Status Do different parameterizations between gas exchange and wind matter? Global uptakes Liss and Merlivat-83: 1 Pg C yr-1 Wanninkhof-92: 1.85 Pg C yr-1 Wanninkhof&McGillis-98: 2.33 Pg C yr-1 Zemmelink-03: 2.45 Pg C yr-1 Yes! Global average k (=21.4 cm/hr): 2.3 Pg C yr-1 We might not know exact parameterization with forcing but forcing is clearly important Compare with net flux of 1.3 PgCy-1 (1.9 - 0.6) in Sarmiento and Gruber (2002), Figure 1
What happens to the CO2 that dissolves in water? CO2 is taken up by ocean biology to produce a flux of organic mater to the deep sea (BorgC) CO2 + H2O = CH2O + O2 Some carbon is taken up to make a particulate flux of CaCO3 (BCaCO3) Ca2+ + 2HCO3- = CaCO3(s) + CO2 + H2O The biologically driven flux is called the “Biological Pump”. The sediment record of BorgC and BCaCO3 are used to unravel paleoproductivity. The flux of BorgC to sediments drives an extensive set of oxidation-reduction reactions that are part of sediment diagenesis. Carbonate chemistry controls the pH of seawater which is a master Variable for many geochemical processes.
Photosynthesis/respiration (shown as apparent oxygen utilization or AOU = O2,sat – O2,obs) and CaCO3 dissolution/precipitation vectors (from Park, 1969) CH2O + O2→ CO2 + H2O as O2↓ AOU ↑ CO2 ↑