Download
1 / 27
270 likes | 420 Views
Stephen Plummer (IGBP-ESA) Jing Chen and Feng Deng (U. Toronto) Philippe Ciais (LSCE) Nadine Gobron (JRC) Roselyne Lacaze (MEDIAS) Tristan Quaife and Martin De Kauwe (CTCD). Global Trends in LAI, F APAR , Burned Area and Fire using Earth Observation. 6.5 Pg C/yr. 3.5 Pg C/yr.

E N D
Stephen Plummer (IGBP-ESA) Jing Chen and Feng Deng (U. Toronto) Philippe Ciais (LSCE) Nadine Gobron (JRC) Roselyne Lacaze (MEDIAS) Tristan Quaife and Martin De Kauwe (CTCD) Global Trends in LAI, FAPAR, Burned Area and Fire using Earth Observation Canberra, Australia
6.5 Pg C/yr 3.5 Pg C/yr 2.5 Pg C/yr 1 Pg C/yr Scientific Context Growth rate of carbon reservoirs Fossil fuel emissions Net UptakeOcean & Land Accumulation rate in ocean and on land Accumulation rate inatmosphere Large interannual variation in the annual atmospheric CO2 growth rate Source: Sarmiento & Gruber, 2002, Physics Today, 55, 30-36 Canberra, Australia
Inter-annual variations in CO2 growth rate Canberra, Australia
Regional greening and browning? (% per year) Nemani et al., Science 2003 Secular increase in primary productivity from satellite NDVI over the past 25 years Canberra, Australia
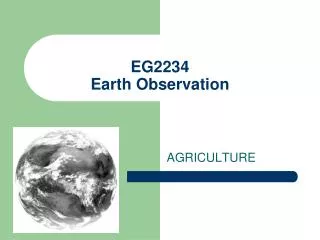
Scientific Context Leaf Area Index FAPAR Burned Area Active Fire Conclusions Global Trends in LAI, FAPAR, Burned Area and Fire using Earth Observation Canberra, Australia
Leaf Area Index GLOBCARBON Feng Deng, Jing Chen Deng et al. in press, TGARS Canberra, Australia
GLOBCARBON vs. MODIS - 1 Degraded to 10km, Barton Bendish (UK) 2001 Canberra, Australia
GLOBCARBON vs. MODIS - 3 Degraded to 10km, Oregon (USA) 2001 Canberra, Australia
Scientific Context Leaf Area Index FAPAR Burned Area Active Fire Conclusions Global Trends in LAI, FAPAR, Burned Area and Fire using Earth Observation Canberra, Australia
The 2003 European Heat wave Philippe Ciais Canberra, Australia
Changes in FPAR between 2003 and former years Philippe Ciais Canberra, Australia
Biosphere Energy-Transfer HYdrology model Vegetation ‘Trend’ 1999–2003 decrease increase Decrease Increase Nadine Gobron Canberra, Australia Knorr et. al. (2005) ‘ Global-Scale Drought Caused Atmospheric CO2 increase’, EOS, Transactions 86(18):178 & 181, 2005.
Niño3-SST Anomalies…1 Precipitation 99% significance NINO3 measures the strength of an ENSO event as the SSTA averaged over [5S,5N] and [150W,90W]. Image from: http://ingrid.ldeo.columbia.edu/descriptions/.nino3.html Canberra, Australia Chen et al./NCEP-ClimatePrediction Centre
1998 1999 2000 2001 2002 2003 ‘Trends’ at global scales Nadine Gobron Canberra, Australia
Scientific Context Leaf Area Index FAPAR Burned Area Active Fire Conclusions Global Trends in LAI, FAPAR, Burned Area and Fire using Earth Observation Canberra, Australia
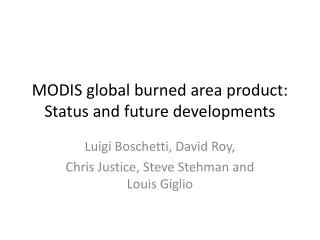
Burned Area – No product = No trend • Year 2000 – two independent demonstrators of global burned area: GLOBSCAR and GBA-2000 GBA-2000 Globscar • GLOBCARBON uses the experience of these and some of the algorithms to produce a single burned area product – multi-annually. Canberra, Australia
Results – 1 km (Angola) July 1998 Algorithm Detection (GLOBSCAR, GBA, Both) GLOBSCAR only GBA only Both algorithms Canberra, Australia
MODIS Comparison – 1 km MODIS GLOBCARBON July 2000 June 29 Canberra, Australia
Scientific Context Leaf Area Index FAPAR Burned Area Active Fire Conclusions Global Trends in LAI, FAPAR, Burned Area and Fire using Earth Observation Canberra, Australia
World Fire Atlas • 308 or 312K – 3.7μm channel • Global • 1995-present • ATSR-2 + AATSR • 1km*1km • 3-day repeat • monthly files in ascii format (Date, Lat and Long) • http://dup.esrin.esa.int/ionia/wfa/ • Underestimation, industrial sites not masked, night-time Canberra, Australia
Satellites do not see everythingTRMM v ATSR-2 (Jan 98) Canberra, Australia
Diurnal Schematic 1.2 ERS-2 MODIS MODIS NOAA-14 1 ENVISAT NOAA-12 0.8 NOAA-12 0.6 Normalised solar position Fire 1 Fire 1 (next day) 0.4 MODIS ENVISAT Fire 2 NOAA-14 Fire 3 MODIS 0.2 ERS-2 0 1 2 3 4 5 6 7 8 9 10 11 12 13 14 15 16 17 18 19 20 21 22 23 24 Time (hrs) Canberra, Australia
Seasonal – Inter-annual Canberra, Australia
Continental Canberra, Australia
While the products are becoming available, LAI currently does not have sufficient consistency for long times series analysis globally. Attempts to do so are possible but they should be viewed with caution. FAPAR derived from space has been shown to reliably exhibit strong signatures of climate and other stress impacts on vegetation. Conclusion - 1 Canberra, Australia
Burned area represents a similar story to LAI but with fewer products and there are problems at regional scales. GLOBCARBON will provide 10 years once reprocessed and MODIS is coming… Active fire data exist as long time series (ATSR-2 WFA, TRMM, MODIS) but they represent snapshots (no one product is better than another). They provide a means to examine climate trends and regional variation but ultimately it requires high resolution geostationary for continuous diurnal monitoring Continuity of biophysical products over long time series are needed with various instruments: Same type of high level products complete with quality values Validation and comparison exercises for quality assessments. Consistency over time and between products Conclusions - 2 Canberra, Australia
Canberra Fires Jan 15 2003 Hot spots detected by ATSR-2 (left) and AATSR (right) with ½ hour spacing. Below actual scene zoom with saturated pixels in blue (>312deg) Canberra, Australia