Download
1 / 26
310 likes | 530 Views
Life cycle assessment of biochar systems. Kelli G. Roberts, Brent A. Gloy, Stephen Joseph, Norman R. Scott, Johannes Lehmann Department of Crop and Soil Sciences, Cornell University Northeast Biochar Symposium UMass Amherst November 13, 2009. materials. manufacture. use. end of life.

E N D
Life cycle assessment of biochar systems Kelli G. Roberts, Brent A. Gloy, Stephen Joseph, Norman R. Scott, Johannes Lehmann Department of Crop and Soil Sciences, Cornell University Northeast Biochar Symposium UMass Amherst November 13, 2009
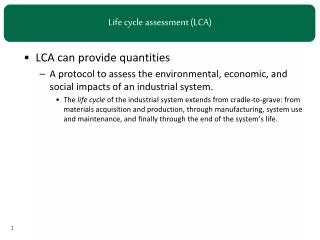
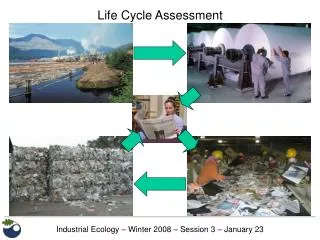
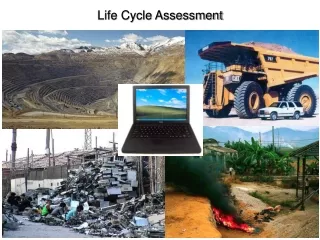
materials manufacture use end of life What is Life Cycle Assessment (LCA)? • Methodology to evaluate the environmental burdens associated with a product, process or activity throughout its full life by quantifying energy, resources, and emissions and assessing their impact on the global environment. • LCA has been standardized by the ISO (International Organization for Standardization). Life cycle of a product
Goals of the LCA • To conduct a cradle-to-grave analysis of the energy, greenhouse gas, and economic inputs and outputs of biochar production at a large-scale facility in the US. • To compare feedstocks (corn stover, yard waste, switchgrass).
Scope: the functional unit • The functional unit: • A measure of the performance or requirement for a product system. • Provides a reference so that alternatives can be compared. • Our functional unit: • The management of one tonne of dry biomass.
System boundaries Dashed arrows with (-) indicate avoided processes. The “T” represents transportation.
Biochar with heat co-product Installation at Frye Poultry Farm, West Virginia capacity of 300 kg dry litter hr-1 www.coaltecenergy.com
LCA of biochar – industrial scale • Plant throughput 10 t dry biomass hr-1 • Runs at 80% capacity • The slow pyrolysis process has four co-products: • Biomass waste management • Biochar soil amendment • Bioenergy heat production • Carbon sequestration
Energy flows: feedstock to products Sankey diagram, per dry tonne stover
Feedstocks • Corn stover • Late and early harvest (15% and 30% mcwb). • Second pass collection, harvest 50% above ground biomass. • Yard waste • 45% mcwb • No environmental burden for production. • Assumed to be diverted from large-scale composting facility. • Switchgrass • 12% mcwb • Scenarios A and B to capture range of GHG flows associated with land-use change
Feedstocks (cont.) • Switchgrass A • Lifecycle emissions model (Deluchi), informally models land-use change. • Assumes land conversion predominantly temperate grasses and existing croplands, rather than temperate, tropical or boreal forests. • Net GHG of +406.8 kg CO2e t-1 dry switchgrass harvested. • Switchgrass B • Searchinger et al (2008) global agricultural model. • Assumes land conversion in other countries from forest and pasture to cropland to replace the crops lost to bioenergy crops in the U.S. • Net GHG of +886.0 kg CO2e t-1 dry switchgrass harvested. Deluchi, M. “A lifecycle emissions model (LEM)”; UCD-ITS-RR-03-17; UC Davis, CA, 2003. Searchinger, T.; et al. Science 2008, 319 (5867), 1238-1240.
All feedstocks are net energy positive. Switchgrass has the highest net energy. Agrochemical production and drying consume largest proportion of energy. Biomass and biochar transport (15 km) consume < 3%. “Other” category includes biochar transport, plant dismantling, avoided fertilizer production, farm equipment, and biochar application. Energy balance
Stover and yard waste have net (-) emissions (greater than -800 kg CO2e). However, switchgrass A has -442 kg CO2e of emissions reductions, while B actually has net emissions of +36 kg CO2e. “Other” category includes biomass transport, biochar transport, chipping, plant construction and dismantling, farm equipment, biochar application and avoided fertilizer production. GHG emissions balance
Biomass and biochar transport (15 km) each contribute < 3%. The stable C sequestered in the biochar contributes the largest percentage (~ 56-66%) of emission reductions. Avoided natural gas also accounts for a significant portion of reductions (~26-40%). Reduced soil N2O emissions upon biochar application to the soil contributes only 2-4% of the total emission reductions. GHG emissions (cont.)
High revenue scenario $80 t-1 CO2e Low revenue scenario $20 t-1 CO2e Economic analysis • The high revenue of late stover (+$35 t-1 stover). • Late stover breakeven price is $40 t-1 CO2e. • Switchgrass A is marginally profitable. • Yard waste biochar is most economically viable. • Highest revenues for waste stream feedstocks with a cost associated with current management.
Stable C vs. life cycle emissions • Yard waste still most profitable • Stover and switchgrass have switched
Transportation sensitivity analysis • The net revenue is most sensitive to the transport distance, where costs increase by $0.80 t-1 for every 10 km. • The net GHG emissions are less sensitive to distance than the net energy. • Transporting the feedstock and biochar each 200 km, the net CO2 emission reductions decrease by only 5% of the baseline (15 km). • Biochar systems are most economically viable as distributed systems with low transportation requirements.
Biochar-to-soil vs. biochar-as-fuel Net GHG • Biochar-as-fuel: biochar production with biochar combustion in replacement of coal are -617 kg CO2e t-1 stover • Biochar-to-soil: -864 kg CO2e t-1 stover • 29% more GHG offsets with biochar-to-soil rather than biochar-as-fuel
Biomass direct combustion vs. biochar-to-soil Net GHG • Not including avoided fossil fuels: • Biomass direct combustion: +74kg CO2e t-1 stover • Biochar-to-soil: -542 kg CO2e t-1 stover • Emission reductions are greater for a biochar system than for direct combustion • With avoided natural gas: • Biomass direct combustion: -987kg CO2e t-1 stover • Biochar-to-soil: -864 kg CO2e t-1 stover • Net GHG look comparable • However, for biochar-to-soil, 589 kg of CO2 are actually removed from the atmosphere and sequestered in soil, whereas the biomass combustion benefits from the avoidance of future fossil fuel emissions only • Transparent system boundaries
Conclusions • Careful feedstock selection is required to avoid unintended consequences such as net GHG emissions or consuming more energy than is generated. • Waste biomass streams have the most potential to be economically viable while still being net energy positive and reducing GHG emissions (~ 800 kg CO2e per tonne feedstock). • Valuing greenhouse gas offsets at a minimum of $40 t-1 CO2e and further development of pyrolysis-biochar systems will encourage sustainable strategies for renewable energy generation and climate change mitigation.
Preliminary results: Mobile unit for stover biochar Without energy capture Net GHG = -550 kg CO2e t-1 stover Net energy = -1000 MJ t-1 stover Next steps • Different biochar-pyrolysis sytems • Mobile unit • Small-scale non-mobile, batch units • With and without energy capture www.biocharengineering.com Brazilian type metal kiln, Nicolas Foidl
Next steps • Developing country scenarios • Household cook stoves • Village scale units • Central plant at biomass source • Different feedstocks • Manures • Native grasses onmarginal lands Pro-Natura in Senegal Cook stoves in Kenya
Acknowledgements • Cornell Center for a Sustainable Future (CCSF) • John Gaunt (Carbon Consulting) Jim Fournier (Biochar Engineering)Mike McGolden (Coaltec Energy) • Lehmann Biochar Research Group, especially Kelly Hanley, Thea Whitman, Dorisel Torres, David Guerena, Akio Enders Thank you!