Download
1 / 31
600 likes | 1.24k Views
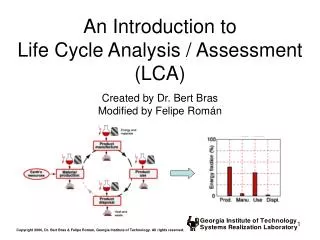
Life Cycle Assessment - LCA. Outline. Introduction. Phases of an LCA. Goal and scope definition. Inventory analysis (LCI). Life Cycle Impact Assessment. Case Study. What Are the Benefits of Conducting an LCA?. Limitations of Conducting an LCA. Introduction. SUSTAINABLE DEVELOPMENT.

E N D
Outline Introduction Phases of an LCA Goal and scope definition Inventory analysis (LCI) Life Cycle Impact Assessment Case Study What Are the Benefits of Conducting an LCA? • Limitations of Conducting an LCA
Introduction SUSTAINABLE DEVELOPMENT Development which satisfies the needs of the present without compromising the possibility for future generations to satisfy their own needs RESILIENCE GROSS NATIONAL PRODUCT WELFARE
A brief history • Originated from energy analysis and some claim first LCA carried out by coca cola in 1969 • SETAC set first standards in 1990 • ISO produced series of standards in 1997/98 which were recently revised – ISO 14047:2012 Life cycle assessment - Illustrative examples – ISO 14049:2012 Illustrative examples on how to apply ISO 14044 – ISO 14067:2013 Greenhouse gases - Carbon footprint of products
Goal and scope definition • Functional unit • System boundaries; • Assumptions and limitations; • Allocation methods used to partition the environmental load of a process when several products or functions share the same process; • Impact categories chosen.
Life Cycle Impact Assessment • There is no universal Life Cycle Impact Assessment (LCIA) • Each case will vary e.g. in relation to the number of categories in the analysis and their definition
Global warming potential, GWP. Some of the gases in the Earth’s atmosphere (in particular water vapour and carbon dioxide) have an ability to absorb infra-red radiation. Global Impacts- polar melt, soil moisture loss, longer seasons, forest loss/change, and change in wind and ocean patterns. Characterisation factor: KG of GWP 100 (Global Warming Potential over a time horizon of 100years). Indicator: Kg of CO2 equivalent. Ozone depletion potential, ODP. Ozone forms a layer in the stratosphere protecting plants and animals from much of the sun’s harmful UV radiation. Global Impacts - increased ultraviolet radiation. Characterisation factor: KG of ODP (Ozone Depletion Potential in stationary conditions). Indicator: Kg of CFC-11 equivalent.
Acidification, AP. Acidification originates from the emissions of sulphur dioxide and oxides of nitrogen. Regional Impacts- building corrosion, water body acidification, vegetation effects, and soil effects. Characterisation factor: KG of AP (Acidification Potential). Indicator: Kg of H+ equivalent.
Global Impacts • Global Warming - polar melt, soil moisture loss, longer seasons, forest loss/change, and change in wind and ocean patterns. • Ozone Depletion - increased ultraviolet radiation. • Resource Depletion -decreased resources for future generations. • Regional Impacts • Photochemical Smog - “smog,” decreased visibility, eye irritation, respiratory tract and lung irritation, and vegetation damage. • Acidification - building corrosion, water body acidification, vegetation effects, and soil effects. • Local Impacts • Human Health - increased morbidity and mortality. • Terrestrial Toxicity - decreased production and biodiversity and decreased wildlife for hunting or viewing. • Aquatic Toxicity - decreased aquatic plant and insect production and biodiversity and decreased commercial or recreational fishing. • Eutrophication – nutrients (phosphorous and nitrogen) enter water bodies, such as lakes, estuaries and slow-moving streams, causing excessive plant growth and oxygen depletion. • Land Use - loss of terrestrial habitat for wildlife and decreased landfill space. • Water Use - loss of available water from groundwater and surface water sources.
B.- Classification - assigning LCI results to the impact categories C. Characterization - modelling LCI impacts within impact categories using science-based conversion factors Inventory Data × Characterization Factor = Impact Indicators Example Chloroform GWP Factor Value = 9 Quantity Methane GWP Factor Value = 21 Quantity Chloroform GWP Impact = 20 kg x 9 = 180 kg CO2 equivalents Methane GWP Impact = 10 kg x 21 = 210 kg CO2 equivalents
D. Normalization and Weighting - expressing potential impacts in ways that can be compared • The weighting step assigns weights or relative values to the different impact categories based on their perceived importance or relevance. • Because weighting is not a scientific process, it is vital that the weighting methodology is clearly explained and documented. 1 MJ of electrical energy Acidification (kg H+ eq. 0.2) Eutrophication (kg PO4 eq. 0.6) Global warming potential (kg CO2 eq. 1.3) Acidifi. (kg H+ eq. 0.1) Eutroph. (kg PO4 eq. 0.4) GWP (kg CO2 eq. 2.1)
Case Study ELECTRICAL DISTRIBUTION BOARDS Improve the performance of the electrical distribution board, in terms of environmental impact
1 - Goal Definition and Scoping Object of analysis: low tension distribution boards (<1000 V;1250-6300 A) Functional Unit: unit that appropriately describes the function of the product or process being studied Differences in size, output and efficiency between single machines Capacity to distribute 1 MJ of electrical energy Acceptable error: the maximum acceptable error for each single category of impact referred to the whole life cycle is 5%; this is in fact the variance which exists between the data for environmental impact when several data bases are compared.
Electrical distribution boards “A58”. low protection index, temperature of 35°C and range of current [0 A; 1250 A].
Some groups of codes were excluded from the analysis (functional elements for manoeuvre, such as switches, isolating switches etc.) The value of the total mass excluded remains under 5%
3. Life Cycle Impact Assessment A - Selection and Definition of Impact Categories - Acidification, AP - Eutrophication - Global warming potential, GWP - Ozone depletion potential, ODP - Photochemical ozone creation, POCP
B - Identification of any harmful substances emitted per impact category (classification). • For example, for the Acidification impact (AP), expressed in kg of H+ equivalents, out of all the emissions caused by the cold rolling production process only those which concern this impact category are shown in the table • * the amounts emitted refer to one ton of product The sources of the data used are mainly bibliographical and public and include the principal European LCI databases such as ETH-ESU, BUWAL and APME
C - Identification of the CF (Characterisation Factor) for each single substance identified above (characterisation); According to ISO TR 14025 the harmful substances for this impact category are:
Calculation of the PI (potential impact) of the single raw material or the energy for each single impact (characterisation). (1,60E+00 8,145 + 5,00E-01 4540 + 1,20E+00 6180)/1000000 = 9,70E-03 [kg of H+ ion eq./kgsteel]
For each category the total impacts, referred to the production and the component assembly stages, have been calculated 9,70E-03 x 140,05 kg + 1,44E-01 x 5,10 kg + 1.93E-02 x 1,12 kg = 2,12 [kg of H+ ion eq.]
What Are the Benefits of Conducting an LCA? • help decision-makers: • Develop a systematic evaluation of the environmental consequences associated with a given product. • Analyze the environmental trade-offs associated with one or more specific products/processes to help gain stakeholder (state, community, etc.) acceptance for a planned action. • Quantify environmental releases to air, water, and land in relation to each life cycle stage and/or major contributing process. • Assess the human and ecological effects of material consumption and environmental releases to the local community, region, and world.
Limitations of Conducting an LCA • -Performing an LCA can be resource and time intensive • Gathering the data can be problematic, and the availability of data can greatly impact the accuracy of the final results. • -LCA will not determine which product or process is the most cost effective or works the best. • Therefore, the information developed in an LCA study should be used as one component of a more comprehensive decision process assessing the trade-offs with cost and performance, • - There are a number of ways to conduct LCIA • Converting the impact results to a single score requires the use of value judgments, which must be applied by the commissioner of the study or the modeler, but it cannot be done based solely on natural science.