Download
1 / 21
210 likes | 334 Views
Extreme precipitation events in the Southeast US. TN flooding May 2010. Asheville, NC 2004. A preliminary investigation of operational forecast challenges related to moisture sources and transport. State Climate Office of North Carolina. TN flooding May 2010. Asheville, NC 2004.

E N D
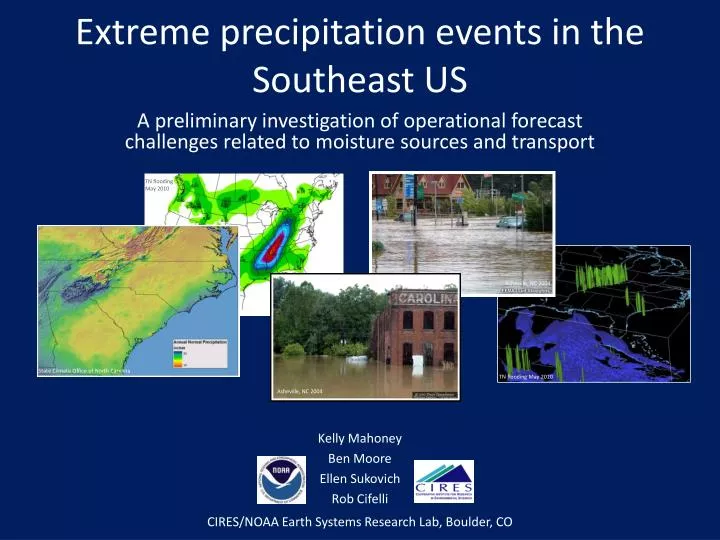
Extreme precipitation events in the Southeast US TN flooding May 2010 Asheville, NC 2004 A preliminary investigation of operational forecast challenges related to moisture sources and transport State Climate Office of North Carolina TN flooding May 2010 Asheville, NC 2004 Kelly Mahoney Ben Moore Ellen Sukovich Rob Cifelli CIRES/NOAA Earth Systems Research Lab, Boulder, CO
Motivation: Forecasting extreme precipitation in the southeast U.S. Asheville, NC September 2004 • Southeast U.S. experiences extreme rainfall during all seasons • Large variability in types of flood-producing weather systems • Both coastal and mountainous terrain • Recent high-impact events highlight additional challenges: urbanization/changing watershed hydrology, communication between decision-making bodies Atlanta, GA September 2009 Melissa Tuttle Carr Nashville, TN May 2010 AP Photo/Mark Humphrey
NOAA’s Hydrometeorology Testbed (HMT) • HMT conducts research on precipitation and weather conditions that can lead to flooding • Fosters transition of scientific advances and new tools into forecasting operations • Accelerates development , prototyping of advanced hydrometeorological observations, models, and physical process understanding • HMT-Southeast: 2 parts • Pilot Study in western North Carolina (Spring 2013 – Fall 2014) • Operationally-oriented research on extreme precipitation and forecast challenge identification HMT’s regional projects HMT-Southeast Pilot Study map Mobile atmospheric river observatory (as used in HMT-West and HMT-Northwest)
HMT-Southeast: Research Questions • What is the climatology of extreme precipitation events in the southeast U.S.? • How do QPF errors relate to the largest observed precipitation events? • What are the primary moisture sources and moisture transport mechanisms for extreme rainfallin the southeast U.S.? • Research approach: • Climatology of observed extreme events and associated environments • Climatology of QPF successes, errors • Case studies of observed extreme events: Diagnostic observational analysis, numerical model-based experiments
1. Climatology of extreme precipitation events in the Southeast: Data and methods • Data sources: • Daily (12Z–12Z) precipitation accumulations for 2002–2011 NCEP Stage-IV QPE product at 4-km resolution • NARR and CFSR used to examine environmental characteristics of events • Previous climatologies exist: many use gauge/station data • Gridded dataset facilitates better coverage, diagnosis of event spatial characteristics; flexible approach 99th percentile of 24-h precipitation (mm) Southeast domain • Method of event identification: • 99th percentile of 24-h precipitation calculated at each grid point for all days with precipitation >0 • Extreme precipitation “events”: 24-h periods for which the 99th percentile threshold was exceeded at >1000 grid points (~16000 km2) within “southeast” domain • Tropical/non-tropical classification using National Hurricane Center Best Track information + national radar mosaic imagery • This presentation focuses primarily on non-tropical events
Climatology of extreme precipitation events in the Southeast Locations of maximum 24-h precipitation for each extreme precipitation event Monthly frequency distribution of non-tropical and tropical events × × = Non-tropical (N=140) = Tropical (N=44) • Salient climatological characteristics: • Non-tropical events most common in interior southeast; tropical events most common along east coast • Extreme precipitation events occur in all months in southeast; least common in summer months • Non-tropical events most frequent in May; tropical events most frequent in Sept • West of Appalachians and in Gulf Coast states, non-tropical events most frequent in DJF and MAM • East of Appalachians, non-tropical events most frequent in SON
Classification of non-tropical events Key question: How does magnitude of water vapor transport relate to precipitation amount? • Approach: • Quantify water vapor transport: vertically integrated water vapor transport (IVT) • For each event, average the 24-h time-integrated IVT from NARR within 5° lat × 5° lon box centered on maximum precipitation location • Examine correlation between maximum precipitation amount and IVT value Weak IVT, large precip. N=19 Strong IVT, large precip. N=15 • Results and additional questions: • Nearly zero correlation observed between max precipitation and IVT • How are large precipitation events with weak IVT distinguished from those with strong IVT? • Compare largest events in the strongest, weakest IVT terciles 24-h max precipitation (mm) R2 = .002 Integrated water vapor transport
Extreme precipitation climatology: Key properties of events CAPE Areal coverage Significant at 99.9th % level Significant at 93.9th % level • Weak IVT, large precipitation events: • More localized/small-scale • Larger CAPE • Weaker QG forcing for ascent Weak IVT, large precip Strong IVT, large precip Weak IVT, large precip Strong IVT, large precip • Strong IVT, large precipitationevents: • More widespread/larger-scale • Weaker CAPE • Stronger QG forcing for ascent 850–700-hPa layer-averaged Q-vector convergence Precipitable water Significant at 98.6th % level Strong IVT, large precip Weak IVT, large precip Weak IVT, large precip Strong IVT, large precip Analysis uses CFSR dataset for 6-h largest precipitation period using maximum value (of PW, CAPE, Q-vectconv) within 5° lat × 5° lon area centered on event
Composite synoptic-scale environment of “strong IVT, large precipitation” events N=15 250-hPa Z (dam), wind speed (m s−1) IVT (kg m−1s−1) • Key characteristics • Amplified upper-level trough-ridge couplet, strong jet streak • Intense corridor of strong IVT from low latitudes; connection to subtropics/tropics? • Strong low-level winds and poleward-extending moisture plume; low-level warm advection in precipitation region • Flow of warm, moist, unstable air moderate CAPE + + PW (mm); 850-hPa Z (dam), θ (K) CAPE (J kg−1); 925-hPa Z (dam) + + * Composites are event-relative; geography shown for spatial reference and distance scaling only. Computed using CFSR at beginning of 6h period of largest precip
Composite synoptic-scale environment of “weak IVT, large precipitation” events N=19 250-hPa Z (dam), wind speed (m s−1) IVT (kg m−1s−1) • Key characteristics • Zonal upper-level flow pattern; precipitation region south of equatorwardentrance of weak jet streak and downstream of weak short-wave trough • Gradual polewardlow-level flow of very moist air around subtropical anticyclone • Precipitation region on warm side of quasi-stationary baroclinic zone in weak warm advection • Much larger CAPE values than “Strong IVT” composite + + PW (mm); 850-hPa Z (dam), θ (K) CAPE (J kg−1); 925-hPa Z (dam) + + * Composites are event-relative; geography shown for spatial reference and distance scaling only. Computed using CFSR at beginning of 6h period of largest precip
Research Questions • What is the climatology of extreme precipitation events in the southeast U.S.? • How do QPF errors relate to the largest observed precipitation events? • What are the primary moisture sources and moisture transport mechanisms for extreme rainfall in the southeast U.S.? • Research approach: • Climatology of observed extreme events and associated environments • Climatology of QPF successes, errors • Case studies of observed extreme events: Diagnostic observational analysis, numerical model-based experiments
Forecast skill for extreme precipitation events: : Forecast and Evaluation Data Example QPF from HPC Data Period: 1 January 2002 - 31 December 2011 Forecasts: • HPC CONUS Quantitative Precipitation Forecasts (QPF) • 32-km resolution • Forecasts valid 12Z to 12Z • Day 1 (24 h) forecasts evaluated here Verification/quantitative precipitation estimates (QPE) • Stage IV data • 32-km resolution (upscaled from 4-km) • Accumulated precipitation from 12Z to 12Z Example QPE from Stage IV
QPE vs. QPF:Tropical vs. Non-Tropical Events Tropical Extreme Events Non-tropical Extreme Events Non-tropical events: underforecasting higher precipitation amounts Tropical events show slight tendency for overforecasting lowerprecipitation amounts
QPE vs. QPF: Strong IVT vs. Weak IVT cases “Strong IVT, Large Precip” extreme events “Weak IVT, Large Precip” extreme events Weak IVT cases: underforecast at higher precipitation amounts Strong IVT cases: also underforecast at higher precipitation amounts, but not by as much
Ongoing work and future directions • Climatology: More compositing, sub-regional event types, focus on event subsets associated with largest QPF errors • QPF: QPF error assessments using traditional verification metrics and spatial verification, expand to additional forecast datasets (NWP and human-generated) • Case studies, process studies: diagnostic assessments, NWP experiments • R2O: Connecting with operational community Object-based spatial QPF verification example: Atlanta floods: 20 September 2009 Case study example: WRF model diagnostic/sensitivity studies of 2010 Tennessee floods Moore et al. (2012) HPC Day-1 QPF NPVU 24 h QPE Challenging forecast, high-impact event WRF simulated water vapor (purple) and rain (cyan) mixing ratio surfaces Observed vs. WRF-simulated radar reflectivity
Summary “Weak IVT, Large Precip” “Strong IVT, Large Precip” • Southeast U.S. experiences extreme rainfall over all seasons • Characterizing events, QPF errors in terms of moisture sources, transport properties helps to identify forecast challenges • Weak IVT, large precipitation events: • More localized/small-scale • Larger CAPE • Weaker QG forcing for ascent • Strong IVT, large precipitation events: • More widespread/larger-scale events • Weaker CAPE • Stronger QG forcing for ascent • Underpredictionsof large precip amounts slightly greater in cases with weaker IVT • Much work remains; regional partnerships, collaboration key
Acknowledgements • U.S. Weather Research Program, NOAA ESRL’s Physical Sciences Division for financial support • Hydrometeorological Prediction Center • NWS Eastern Region Headquarters • HMT-SE Planning Workshop participants • NASA’s Global Precipitation Measurement mission • Ana Barros (Duke University) -- Pilot Study instrumentation collaboration
HMT-Southeast Pilot Study (“HMT-SEPS”) • Planned for May 2013 – September 2014 in western North Carolina • Largely focused on QPE in western NC (but some instrumentation in central and eastern NC) • NOAA will bring instrumentation and also leverage additional assets from NASA ground validation campaign • Exact deployment plan still in development; likely components include: • 3 profiling radars (including 449 MHz for wind profiling with RASS and S-band for precipitation vertical structure). • An upgrade to the Charlotte profiler. A nearby GPS receiver will provide integrated water vapor measurements. • The NASA GPM program will deploy instrumentation as part of COPrHEX. NASA may also support deployment of additional NOAA resources for HMT-SEPS • HMT-SEPS main objectives: • Support NWS adaptation to polarimetric radar algorithms • Evaluate and improve QPE systems (e.g., MPE, MRMS, Stage IV)
Atlanta: 20 September 2009 HPC Day-1 24 h QPF NPVU 24 h QPE