Download
1 / 72
730 likes | 815 Views
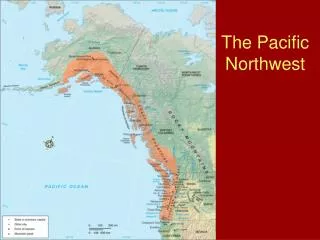
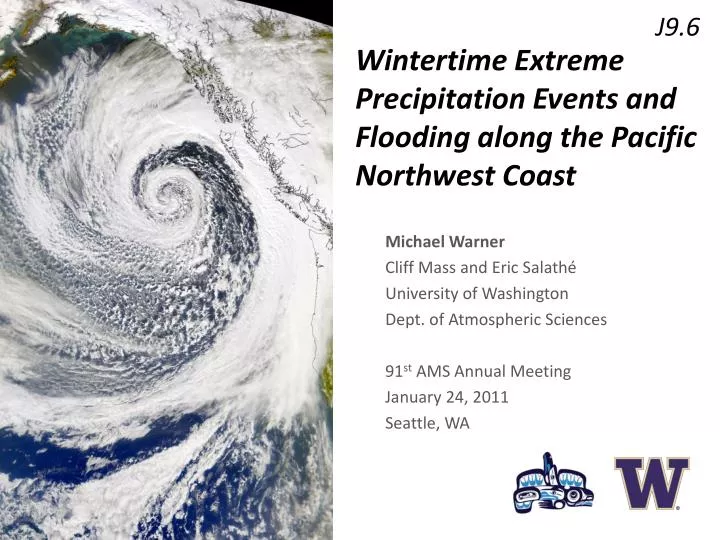
J9.6. Wintertime Extreme Precipitation Events and Flooding along the Pacific Northwest Coast. Michael Warner Cliff Mass and Eric Salathé University of Washington Dept. of Atmospheric Sciences 91 st AMS Annual Meeting January 24, 2011 Seattle, WA. Extreme precipitation.

E N D
J9.6 Wintertime Extreme Precipitation Events and Flooding along the Pacific Northwest Coast Michael Warner Cliff Mass and Eric Salathé University of Washington Dept. of Atmospheric Sciences 91st AMS Annual Meeting January 24, 2011 Seattle, WA
Extreme precipitation • Extreme precipitation event: • large amounts of rain (many inches) in the PNW • extended period of time, usually 1-3 days • winter months (October – March) • Known cause: “atmospheric river” (AR)
Atmospheric river SSMI/AMSRE derived total precipitable water (TPW) [mm] 10 20 30 40 50 60 http://cimss.ssec.wisc.edu/tropic/real-time/tpw2/global/main.html
Atmospheric river (pineapple express) precipitation moisture pineapple Neiman et al., 2008a
Motivation How will climate change affect extreme precipitation frequency and intensity in the Pacific Northwest (PNW)? Use a regional climate model (RCM) for this How and when do extreme precipitation events occur in the PNW in the current climate? Climatology Synoptic features Synoptic features Mesoscale precipitation patterns
Questions • What are the associated synoptic features? How do featureschange along the coast? • Are all events the same? Are there other synoptic configurations that cause extreme precipitation?
Questions • What are the associated synoptic features? How do featureschange along the coast? • Are all events the same? Are there other synoptic configurations that cause extreme precipitation?
Synoptic structure - past composite studies • Lackmann and Gyakum, 1999 • station observation based study • small geographical location • trough/ridge structure, SW flow • Neiman et al., 2008a • satellite based study • entire west coast • differences in composite structure in north vs. south
Daily precipitation data • Global Historical Climate Network (GHCN) • 60 years, 1950-2009 • Close to coast, low elevation, and good spatial distribution
Results – focus on the north (Forks, WA) • Global Historical Climate Network (GHCN) • 60 years, 1950-2009 • Close to coast, low elevation, and good spatial distribution
Results – anomaly composites (Forks, WA) Precipitable Water anomalies 700 hPa geopotential height anomalies 850 hPa temperature anomalies -15 0 15 -25 0 25 -10 0 10 [mm] [dam] [°C] ● ● ● ● ● ● ● ● t (hrs) 60 24 12 0 48 36 72
Results – anomaly composites (Forks, WA) Precipitable Water anomalies 700 hPa geopotential height anomalies 850 hPa temperature anomalies -15 0 15 -25 0 25 -10 0 10 [mm] [dam] [°C] ● ● ● ● ● ● ● ● t (hrs) 60 24 12 0 48 36 72
Results – anomaly composites (Forks, WA) Precipitable Water anomalies 700 hPa geopotential height anomalies 850 hPa temperature anomalies -15 0 15 -25 0 25 -10 0 10 [mm] [dam] [°C] ● ● ● ● ● ● ● ● t (hrs) 60 24 12 0 48 36 72
Results – anomaly composites (Forks, WA) Precipitable Water anomalies 700 hPa geopotential height anomalies 850 hPa temperature anomalies -15 0 15 -25 0 25 -10 0 10 [mm] [dam] [°C] ● ● ● ● ● ● ● ● t (hrs) 60 24 12 0 48 36 72
Results – anomaly composites (Forks, WA) Precipitable Water anomalies 700 hPa geopotential height anomalies 850 hPa temperature anomalies -15 0 15 -25 0 25 -10 0 10 [mm] [dam] [°C] ● ● ● ● ● ● ● ● t (hrs) 60 24 12 0 48 36 72
Results – anomaly composites (Forks, WA) Precipitable Water anomalies 700 hPa geopotential height anomalies 850 hPa temperature anomalies -15 0 15 -25 0 25 -10 0 10 [mm] [dam] [°C] ● ● ● ● ● ● ● ● t (hrs) 60 24 12 0 48 36 72
Results – anomaly composites (Forks, WA) Precipitable Water anomalies 700 hPa geopotential height anomalies 850 hPa temperature anomalies -15 0 15 -25 0 25 -10 0 10 [mm] [dam] [°C] ● ● ● ● ● ● ● ● t (hrs) 60 24 12 0 48 36 72
Results – anomaly composites (Forks, WA) Precipitable Water anomalies 700 hPa geopotential height anomalies 850 hPa temperature anomalies -15 0 15 -25 0 25 -10 0 10 [mm] [dam] [°C] ● ● ● ● ● ● ● ● t (hrs) 60 24 12 0 48 36 72
Results – anomaly composites (Forks, WA) Precipitable Water anomalies 700 hPa geopotential height anomalies 850 hPa temperature anomalies -15 0 15 -25 0 25 -10 0 10 [mm] [dam] [°C] ● ● ● ● ● ● ● ● t (hrs) 60 24 12 0 48 36 72
Results – anomaly composites (Forks, WA) Precipitable Water anomalies 700 hPa geopotential height anomalies 850 hPa temperature anomalies -15 0 15 -25 0 25 -10 0 10 [mm] [dam] [°C] ● ● ● ● ● ● ● ● t (hrs) 60 24 12 0 48 36 72
Results – anomaly composites (Forks, WA) Precipitable Water anomalies 700 hPa geopotential height anomalies 850 hPa temperature anomalies -15 0 15 -25 0 25 -10 0 10 [mm] [dam] [°C] ● ● ● ● ● ● ● ● t (hrs) 60 24 12 0 48 36 72
Results – anomaly composites (Forks, WA) Precipitable Water anomalies 700 hPa geopotential height anomalies 850 hPa temperature anomalies -15 0 15 -25 0 25 -10 0 10 [mm] [dam] [°C] ● ● ● ● ● ● ● ● t (hrs) 60 24 12 0 48 36 72
Results – anomaly composites (Forks, WA) Precipitable Water anomalies 700 hPa geopotential height anomalies 850 hPa temperature anomalies -15 0 15 -25 0 25 -10 0 10 [mm] [dam] [°C] ● ● ● ● ● ● ● ● t (hrs) 60 24 12 0 48 36 72
Results – anomaly composites (Forks, WA) Precipitable Water anomalies 700 hPa geopotential height anomalies 850 hPa temperature anomalies -15 0 15 -25 0 25 -10 0 10 [mm] [dam] [°C] ● ● ● ● ● ● ● ● t (hrs) 60 24 12 0 48 36 72
Results – anomaly composites (Forks, WA) Precipitable Water anomalies 700 hPa geopotential height anomalies 850 hPa temperature anomalies -15 0 15 -25 0 25 -10 0 10 [mm] [dam] [°C] ● ● ● ● ● ● ● ● t (hrs) 60 24 12 0 48 36 72
Results – anomaly composites (Forks, WA) Precipitable Water anomalies 700 hPa geopotential height anomalies 850 hPa temperature anomalies -15 0 15 -25 0 25 -10 0 10 [mm] [dam] [°C] ● ● ● ● ● ● ● ● t (hrs) 60 24 12 0 48 36 72
Results – anomaly composites (Forks, WA) Precipitable Water anomalies 700 hPa geopotential height anomalies 850 hPa temperature anomalies -15 0 15 -25 0 25 -10 0 10 [mm] [dam] [°C] ● ● ● ● ● ● ● ● t (hrs) 60 24 12 0 48 36 72
Results – anomaly composites (Forks, WA) Precipitable Water anomalies 700 hPa geopotential height anomalies 850 hPa temperature anomalies -15 0 15 -25 0 25 -10 0 10 [mm] [dam] [°C] ● ● ● ● ● ● ● ● t (hrs) 60 24 12 0 48 36 72
Results – anomaly composites (Forks, WA) Precipitable Water anomalies 700 hPa geopotential height anomalies 850 hPa temperature anomalies -15 0 15 -25 0 25 -10 0 10 [mm] [dam] [°C] ● ● ● ● ● ● ● ● t (hrs) 60 24 12 0 48 36 72
Results – anomaly composites (Forks, WA) Precipitable Water anomalies 700 hPa geopotential height anomalies 850 hPa temperature anomalies -15 0 15 -25 0 25 -10 0 10 [mm] [dam] [°C] ● ● ● ● ● ● ● ● t (hrs) 60 24 12 0 48 36 72
Results – anomaly composites (Forks, WA) Precipitable Water anomalies 700 hPa geopotential height anomalies 850 hPa temperature anomalies -15 0 15 -25 0 25 -10 0 10 [mm] [dam] [°C] ● ● ● ● ● ● ● ● t (hrs) 60 24 12 0 48 36 72
Results – anomaly composites (Forks, WA) Precipitable Water anomalies 700 hPa geopotential height anomalies 850 hPa temperature anomalies -15 0 15 -25 0 25 -10 0 10 [mm] [dam] [°C] ● ● ● ● ● ● ● ● t (hrs) 60 24 12 0 48 36 72
Results – anomaly composites (Forks, WA) Precipitable Water anomalies 700 hPa geopotential height anomalies 850 hPa temperature anomalies -15 0 15 -25 0 25 -10 0 10 [mm] [dam] [°C] ● ● ● ● ● ● ● ● t (hrs) 60 24 12 0 48 36 72
Results – anomaly composites (Forks, WA) Precipitable Water anomalies 700 hPa geopotential height anomalies 850 hPa temperature anomalies -15 0 15 -25 0 25 -10 0 10 [mm] [dam] [°C] ● ● ● ● ● ● ● ● t (hrs) 60 24 12 0 48 36 72
Results – anomaly composites (Forks, WA) Precipitable Water anomalies 700 hPa geopotential height anomalies 850 hPa temperature anomalies -15 0 15 -25 0 25 -10 0 10 [mm] [dam] [°C] ● ● ● ● ● ● ● ● t (hrs) 60 24 12 0 48 36 72
Results – anomaly composites (Forks, WA) Precipitable Water anomalies 700 hPa geopotential height anomalies 850 hPa temperature anomalies -15 0 15 -25 0 25 -10 0 10 [mm] [dam] [°C] ● ● ● ● ● ● ● ● t (hrs) 60 24 12 0 48 36 72
Results – anomaly composites (Forks, WA) Precipitable Water anomalies 700 hPa geopotential height anomalies 850 hPa temperature anomalies -15 0 15 -25 0 25 -10 0 10 [mm] [dam] [°C] ● ● ● ● ● ● ● ● t (hrs) 60 24 12 0 48 36 72
Results – anomaly composites (Forks, WA) Precipitable Water anomalies 700 hPa geopotential height anomalies 850 hPa temperature anomalies -15 0 15 -25 0 25 -10 0 10 [mm] [dam] [°C] ● ● ● ● ● ● ● ● t (hrs) 60 24 12 0 48 36 72
Results – anomaly composites (Eureka, CA) Precipitable Water anomalies 700 hPa geopotential height anomalies 850 hPa temperature anomalies -15 0 15 -25 0 25 -10 0 10 [mm] [dam] [°C] ● ● ● ● ● ● ● ● t (hrs) 60 24 12 0 48 36 72
Results – anomaly composites (Eureka, CA) Precipitable Water anomalies 700 hPa geopotential height anomalies 850 hPa temperature anomalies -15 0 15 -25 0 25 -10 0 10 [mm] [dam] [°C] ● ● ● ● ● ● ● ● t (hrs) 60 24 12 0 48 36 72
Results – anomaly composites (Eureka, CA) Precipitable Water anomalies 700 hPa geopotential height anomalies 850 hPa temperature anomalies -15 0 15 -25 0 25 -10 0 10 [mm] [dam] [°C] ● ● ● ● ● ● ● ● t (hrs) 60 24 12 0 48 36 72
Results – anomaly composites (Eureka, CA) Precipitable Water anomalies 700 hPa geopotential height anomalies 850 hPa temperature anomalies -15 0 15 -25 0 25 -10 0 10 [mm] [dam] [°C] ● ● ● ● ● ● ● ● t (hrs) 60 24 12 0 48 36 72
Results – anomaly composites (Eureka, CA) Precipitable Water anomalies 700 hPa geopotential height anomalies 850 hPa temperature anomalies -15 0 15 -25 0 25 -10 0 10 [mm] [dam] [°C] ● ● ● ● ● ● ● ● t (hrs) 60 24 12 0 48 36 72
Results – anomaly composites (Eureka, CA) Precipitable Water anomalies 700 hPa geopotential height anomalies 850 hPa temperature anomalies -15 0 15 -25 0 25 -10 0 10 [mm] [dam] [°C] ● ● ● ● ● ● ● ● t (hrs) 60 24 12 0 48 36 72
Results – anomaly composites (Eureka, CA) Precipitable Water anomalies 700 hPa geopotential height anomalies 850 hPa temperature anomalies -15 0 15 -25 0 25 -10 0 10 [mm] [dam] [°C] ● ● ● ● ● ● ● ● t (hrs) 60 24 12 0 48 36 72
Results – anomaly composites (Eureka, CA) Precipitable Water anomalies 700 hPa geopotential height anomalies 850 hPa temperature anomalies -15 0 15 -25 0 25 -10 0 10 [mm] [dam] [°C] ● ● ● ● ● ● ● ● t (hrs) 60 24 12 0 48 36 72
Results – anomaly composites (Eureka, CA) Precipitable Water anomalies 700 hPa geopotential height anomalies 850 hPa temperature anomalies -15 0 15 -25 0 25 -10 0 10 [mm] [dam] [°C] ● ● ● ● ● ● ● ● t (hrs) 60 24 12 0 48 36 72
Results – anomaly composites (Eureka, CA) Precipitable Water anomalies 700 hPa geopotential height anomalies 850 hPa temperature anomalies -15 0 15 -25 0 25 -10 0 10 [mm] [dam] [°C] ● ● ● ● ● ● ● ● t (hrs) 60 24 12 0 48 36 72
Results – anomaly composites (Eureka, CA) Precipitable Water anomalies 700 hPa geopotential height anomalies 850 hPa temperature anomalies -15 0 15 -25 0 25 -10 0 10 [mm] [dam] [°C] ● ● ● ● ● ● ● ● t (hrs) 60 24 12 0 48 36 72