Download
1 / 38
400 likes | 653 Views
Teaching Modeling and Quantitative Cell Biology. R.M. Holmes , A. Cowan , I. Moraru, J Schaff, B. Slepchenko, L.M.Loew. Cell Biology. Cell migration, adhesion, cell cycles, signaling Frogs, fruit flies, worms, plants, bacteria Differentiation, proliferation, morphogenesis…

E N D
Teaching Modeling and Quantitative Cell Biology R.M. Holmes, A. Cowan, I. Moraru, J Schaff, B. Slepchenko, L.M.Loew
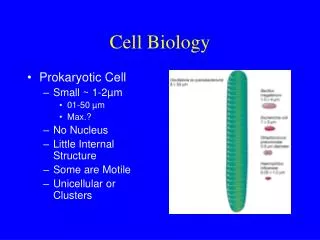
Cell Biology • Cell migration, adhesion, cell cycles, signaling • Frogs, fruit flies, worms, plants, bacteria • Differentiation, proliferation, morphogenesis… • Wound healing, reproduction, angiogenesis • Key question: Which particular factors and interactions are required or sufficient for a biological behavior?
Measure quantitative parameters: concentrations, diffusion coefficients, kinetic constants. Microscopy Cell culture Molecular biology Pharmacological treatments Genetic manipulations
Hypothesis (Model) • What are the initial concentrations, diffusion coefficients and locations of all the implicated molecules? • What are the rate laws and rate constants for all the biochemical transformations? • What are the membrane fluxes and how are they regulated? • How are the forces controlling cytoskeletal mechanics regulated? Quantitative Cell Biology Experiment Predictions Dynamics of Cellular Structures and Molecules Simulation Trends in Cell Biology 13:570-576 (2003)
Curricular Questions for QCB • What topics? • Computing: • Applications? Programming? Software Design? • Mathematics • Statistics? Algebra? Discrete math? Topology? • Biology • Molecular? Cellular?... Multiple answers
Depend on educational goals • Undergraduate: concepts in biology • What is a cell? What are organelles? How does the cell know when to divide? • Graduate: methods and tools for research • What questions can be addressed with…, • what tools are available, how do they work?
The Classrooms Graduate Courses: Cell Biology, Biochemistry • Lecture and Homework • Using VCell to create model and analyze FRAP • Using VCell model to explore biology • Evaluation: • Model creation, correct simulation result. Undergraduate Course: Cellular, Developmental Biology • Research project on Computer Modeling Cell Cycle • Stella, Basic kinetics • Concepts of cell cycle • Evaluation: • Presentation of model, interpretation of results • Survey
Common Approach • Three different faculty and contexts • Use published research literature • e.g. Cell Cycle, PIP2 signaling, Nuclear Transport • Use simulation software • Stella, Virtual Cell • Work with basic reaction kinetics
Undergraduate From Concepts to Concept Maps and Kinetic Reactions
Walking through a Computational Model • Concept Map • Factors and relationships between factors • Describe relationships mathematically • Solve equations: using computer tools • View and interpret results
The Cell Cycle “logic” Kohn, 1999
First Exercise Draw flow diagrams/concept map for the statements provided below. Keep your hand drawings and turn them in. 1. System statements • inactive MPF becomes active MPF • Active MPF becomes inactive MPF 2. System statements • Cyclin is synthesized and degraded • Cyclin stimulates inactive MPF to become active MPF Cell Cycle Diagrams
Mass Action Rate Equations V1=constant V4=k*MPF V2=k*Cyclin*X V5=k*MPF*iX V3=k*iMPF*Cyclin V6=k*X
Evaluation In the models • Constructing correct relationships between biological factors • Ability to write kinetic equations • Describe and interpret graphed results Examinations Answer questions about biology and/or modeling
Student models Wee1 and Cdc25 regulation of Cell Cycle Eq. 1 2.3log [S]0/[S] = kt S=Substrate k=Rate Constant t=Time Ex. Wee1 activation constant [S]= 100 [S] = 50 t = 7.5 2.3log (100/50) = 7.5k k = 0.092 nM-1 min-1 Figure 2. Wee1 model Chung, Morgan-Wesiburg and Murphy
Student models Effect of cyclin-cdc2 binding rates on cell cycle progression We believe that our results support our hypothesis that the cycin-cdc2 binding rate affects the cell cycle. As binding rate increases in relation to dissociation rate, oscillation frequency and amplitude increases; the reverse is true when dissociation rate is greater.
Biological Concepts 1. Proteins in the cell cycle are regulated by phosphorylation and the formation of protein-protein complexes. 2. Cyclin degradation is required for cell cycle progression.
3. The following are needed to make a mathematical model of the cell cycle: Feedback loop All known interacting proteins Rate equations D. Differential equations
Summary 1 Creating models of well described biological systems • Learn key biological concepts • Learn basics of creating numerical models • Work with basic reaction kinetics • Familiar with simulation tool • What was missing • Stronger ties to data generation • Image analysis • Cell population growth
Graduate Classes Ann Cowan
Designed to be used interactively with experiment Enables construction and testing of complex models or rapid investigation of simple hypotheses Geometry from experimental images Math, physics, and numerics are transparent to an experimentalist while fully accessible to a theorist Collaborative distributed database and problem solving environment http://vcell.org
Physiology Applications Applications Applications Math Description Math Description Math Description Applications Molecular Species Compartment Topology Topology Geometry, Initial Conditions, Boundary Conditions, Diffusion Coefficients, Pseudo-steady, Enable/Disable Reactions Topology Geometry, Initial Conditions, Boundary Conditions, Diffusion Coefficients, Pseudo-steady, Enable/Disable Reactions Topology Geometry, Initial Conditions, Boundary Conditions, Diffusion Coefficients, Pseudo-steady, Enable/Disable Reactions Topology Geometry, Initial Conditions, Boundary Conditions, Diffusion Coefficients, Pseudo-steady, Enable/Disable ReactionsElectrophysiology Protocols VCMDL Reactions and Fluxes Simulations Images Images Images Simulations Simulations Simulations Timestep, Mesh Size, Parameter Searches, Sensitivity Timestep, Mesh Size, Parameter Searches, Sensitivity Images Timestep, Mesh Size, Parameter Searches, Sensitivity Timestep, Mesh Size, Parameter Searches, Sensitivity Results Results Results Results
Class: Logic of Modern Biology • Examine simulation results for “injection” applications of “importin alpha cargo” and “importin beta cargo” models. Which cargo is imported into the nucleus faster? • Predict the effects of a mutation in Ran that prevents GTP hydrolysis on the nuclear transport system. How would you introduce this mutation into the model. • 3. Propose a specific change in one of the reactions in the nuclear transport model. Predict the effects of the proposed change on the nuclear transport system.
Exercise: Fluorescence Redistribution After Photobleaching - FRAP
Photobleaching of cytoplasmic components Methods for analyzing the data start with an appropriate model of the biology
Fluorescent Recovery After Photobleaching • There is no universal protocol for FRAP experiments since the design of a FRAP experiment always has to take into account the geometry of the experiment and the bleaching and redistribution characteristics of the molecule under investigation. • I.e. no good way to get D from previous curve. • Can from simulation.
Analysis of Photobleaching using computational modeling First define a physiological model – start with a single compartment and single diffusing species.
Analysis of Photobleaching using computational modeling Import 2D or 3D geometry from microscope images
Analysis of Photobleaching using computational modeling • Create an Application • In this case, the initial concentration of APC is set to 10μM except in bleached region, a 6 X 9 μm rectangle.
Analysis of Photobleaching using computational modeling Create and run a simulation (movie)
Analysis of Photobleaching using computational modeling D = 5 um2/s Compare simulation results with actual experiment
Homework 1. Plot 4 sets of data with different bleach sizes on one plot: Normalize the data to • vs. (t/msqi), where Fi(t) is the fluorescence as a function of time t. 2. Construct model in VCell of diffusing species.
Evaluation • Proper calculations • Running Simulation • Appropriate construction of model • Interpretation of results
Graduate Courses Use of complex models enable students to examine multiple relationships within accepted biological model Simple experimental frameworks can provide rich in quantitative data Simple models can be used to obtain parameter values (D and mobile fraction) from experimentts Overall Classes of 10-20 Creating and exploring models Better understand molecular interactions Appreciation for quantitation, kinetics and behaviors Appreciation for modeling process Conclusions
Resources Available 12/21/07 Exercises available 12/6/07 http://nrcam.uchc.edu/education/ Published Models http://vcell.org
The Virtual Cell Project • John Carson • Yung-Sze Choi • Ann Cowan • Fei Gao • Susan Krueger • Anu Lakshminarayana • Frank Morgan • Igor Novak • Diana Resasco • Li Ye • Rashad Badrawi* • Nick Hernjak* • Daniel Lucio* • John Wagner* • (*alumni)