Download
1 / 15
150 likes | 276 Views
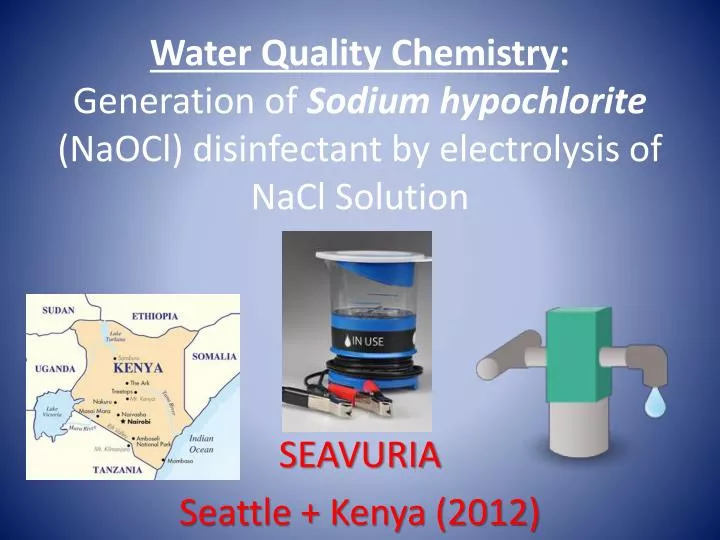
Water Quality Chemistry : Generation of Sodium hypochlorite (NaOCl) disinfectant by electrolysis of NaCl Solution. SEAVURIA Seattle + Kenya (2012). Sodium hypochlorite (NaOCl). NaOCl is produced either when: Chlorine gas is dissolved in sodium hydroxide solution, or

E N D
Water Quality Chemistry: Generation of Sodium hypochlorite (NaOCl) disinfectant by electrolysis of NaCl Solution SEAVURIA Seattle + Kenya (2012)
Sodium hypochlorite (NaOCl) • NaOCl is produced either when: • Chlorine gas is dissolved in sodium hydroxide solution, or • A sodium chloride solution (brine) is treated with electricity (electrolysis) • NaOCl solutions are called liquid bleach or Javelle water • Onsite generation of NaOCl needed due to decomposition over time • (Disinfectant, 1999)
Anode: + electrode Where the oxidation of chloride ions (Cl-), involving the lose of 1 electron (e-) per Cl-, results in the production of chlorine gas (Cl2). Electrolysis: Production of NaOCl Cathode: - electrode Where the reduction of water (H20), involving the gain of 2e-, results in the production of hydrogen gas (H2) and hydroxide ions (OH-). Image courtesy of Boal( 2009)
Oxidant Electrolysis: NaCl + H20 → NaOCl + H2 Sodium chloride (table salt) Water Sodium hypochlorite Hydrogen gas Oxidized Reduced (Boal, 2009) Water Treatment: NaOCl + H20 → HOCl + Na++ OH- Hypochlorous acid • (Disinfectant, 1999)
Typical Chlorine Dosages • (Disinfectant, 1999)
Chlorine: Pathogen Inactivation • In bacteria, chlorine found to adversely affect cell respiration, transport and DNA activity. • Decreases oxygen utilization • Damages cell wall membrane • Decreases levels of DNA synthesis (Haas and Engelbrecht, 1980) • (Disinfectant, 1999)
Chlorine: Environmental Effects • Several environmental factors influence the inactivation efficiency of chlorine, including: • Temperature and pH, • Contact time and mixing, • Turbidity and interfering substances, and • Concentration of available chlorine • Temperature and pH have the most impact on pathogen inactivation by chlorine. • (Disinfectant, 1999)
Chlorine: Effect of Temperature and pH • Temperature: • Pathogen inactivation increases with temperature. • If temperature is lowered by 10C, contact time should be increased 2-3X (Clarke et. Al, 1962) • pH: • Most impact on pathogen inactivation by chlorine • Germicidal efficiency of hypochlorous acid (HOCl) much higher than that of hypochlorite ion (OCl-) • Note: addition of OCl- to water increases pH • HOCl dominates at low pH = ↑ disinfection • At less effective pH contact time should be increased (Culp and Culp, 1974; Scarpino et al., 1972) • (Disinfectant, 1999)
Chlorine: Disinfection Efficacy • Bacteria Inactivation: Chlorine extremely effective as disinfectant for inactivating bacteria • HOCl is 70-80X more effective than OCl- (Culp/Wesner/Culp, 1986) • If temperature is lowered by 10C, contact time should be increased 2-3X (Clarke et. Al, 1962) • Virus Inactivation: Chlorine is highly effective viricide • In 1971 study (0.5 mg/L free chlorine; pH 7.8; 2⁰C): • Reovirus (least resistant): 2.7 min. contact time for 99.99% inactivation (4 log removal) • Poliovirus (most resistant): 60 minute contact time for 99.99% inactivation • 99.99% inactivation for all 20 viruses studied was between 1.4 to >30 mg•min/L (CT values) • Protozoa Inactivation: Chlorine has limited success inactivating protozoa, like Giardia (Hoff et al., 1984); see Figures 2-1, 2-2, and 2-3 for more details • Resistance of Giardiatwo orders of magnitude higher than some viruses • Resistance of Giardia>three orders of magnitude higherthan some bacteria • Chlorine has little impact on viability of Cryptosporidium when used at the relatively low doses encountered in water treatment (e.g., 5 mg/L) • (Disinfectant, 1999)
Figure 2-1. Free Chlorine Giardia and Virus CT Requirements Shows that the CT values (mg•min/L) required to achieve recommended disinfection efficiency for conventional filtration systems (i.e., 0.5-log Giardia cyst and 2-log virus inactivation level) are 23 and 3 mg•min/L, respectively. • (Disinfectant, 1999)
Figure 2-2. CT Values for Inactivation of Giardia Cysts by Free Chlorine a 10⁰C (at Cl2 dose of 3.0 mg/L) According to figure, does the inactivation efficacy of free chlorine increase or decrease with increased pH? • (Disinfectant, 1999)
Figure 2-3. CT Values for Inactivation of Giardia Cysts by Free Chlorine at pH 7.0 ( at Cl2 dose of 3.0 mg/L) According to figure, does the inactivation efficacy of free chlorine increase or decrease with increased temperature? • (Disinfectant, 1999)
Proposed Experiments • Test the effect of pH on chlorine bacterial inactivation • Test the effect of temperature on chlorine bacterial inactivation • Test the effect of contact time on chlorine bacterial inactivation • Test the effectiveness of coffee filters on removing yeast from solution before plating
Additional Information (Disinfectant, 1999) • 2.7.6 Operational Considerations • 2.7.6.1 Application Methods (p. 2-41) • 2.7.6.2 Safety and Handling Considerations (p. 2-42) • 2.8 Summary • 2.8.1 Advantages and Disadvantages of Chlorine Use (p. 2-42 & 2-43) • 2.8.2 Summary Table (Table 2-22, p. 2-44)
References • Boal, Andrew K. "On-Site Generation of Disinfectants." National Environmental Services Center. Spring 2009. Web. 19 Mar. 2012. <http://www.nesc.wvu.edu/pdf/dw/publications/ontap/2009_tb/onsite_generation_DWFSOM133.pdf>. • Clark, N.A., et al. 1962. Human Enteric Viruses in Water, Source, Survival, and Removability, Internal Conference on Water Pollution Research. Landar. • Culp, G.L., and R.L. Culp. 1974. New Concepts in Water Purification. Van Nostrand Reinhold Company, New York, NY. • Culp/Wesner/Culp. 1986. Handbook of Public Water Systems. Van Nostrand Reinhold Company, New York, NY. • "Disinfectant Use in Water Treatment: Chlorine." EPA Guidance Manual. 1999. Web. 19 Mar. 2012. <http://zenbackpacking.net/EPA/Chlorine.pdf>. • Haas C.N. and R.S. Engelbrecht. 1980. “Physiological Alterations of Vegetative Microorganisms Resulting from Aqueous Chlorination.” J. Water Pollution Control Fed. 52(7): 1976. • Hoff, J.C., E.W. Rice, ad F.W. Schaefer. 1984. “Disinfection and the Control of Waterborne Giardiasis.” Conference proceedings, ASCE Specialty Conference. • Scarpino P.V., et al. 1972. “A Comparative Study of the Inactivation of Viruses in Water by Chlorine.” Water Research. 6:959.