Download
1 / 48
510 likes | 945 Views
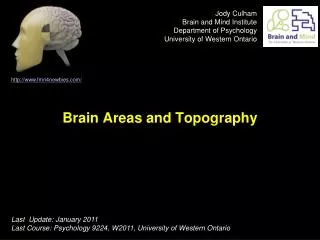
Brain Areas and Topography. Jody Culham Brain and Mind Institute Department of Psychology University of Western Ontario. http://www.fmri4newbies.com/. Last Update: January 2011 Last Course: Psychology 9224, W2011, University of Western Ontario. What Defines an Area?.

E N D
Brain Areas and Topography Jody Culham Brain and Mind Institute Department of Psychology University of Western Ontario http://www.fmri4newbies.com/ Last Update: January 2011 Last Course: Psychology 9224, W2011, University of Western Ontario
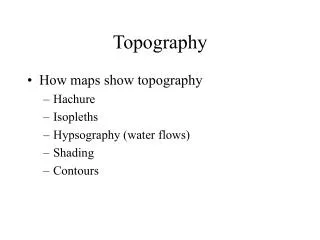
Definition of an “Area” • Neuroimager’s definition of an area: Some blob vaguely in the vicinity (+/- ~3 cm) of where I think it ought to be that lights up for something I think it ought to light up for • Neuroanatomist’s definition of an area: A circumscribed region of the cerebral cortex in which neurons together serve a specific function, receive connections from the same regions, have a common structural arrangement, and in some cases show a topographic arrangement • may also be called a cortical field
Cortical Fields: Anatomical Criteria • Function • an area has a unique pattern of responses to different stimuli • Architecture • different brain areas show differences between cortical properties (e.g., thickness of different layers, sensitivity to various dyes) • Connectivity • Different areas have different patterns of connections with other areas • Topography • many sensory areas show topography (retinotopy, somatotopy, tonotopy) • boundaries between topographic maps can indicate boundaries between areas (e.g., separate maps of visual space in visual areas V1 and V2)
Macaque Visual Maps • Over 30 visual areas • Visual areas make up ~40% of monkey brain Van Essen et al., 2001
Brodmann Area 17 Meets 21st Century Anatomical MRI Functional MRI Layer 4 Logothetis fMRI data: image from http://www.bruker-biospin.com/imaging_neuroanatomy.html Goense, Zappe & Logothetis, 2007, MRI Layer 4 fMRI activation (0.3 x 0.3 x 2 mm spin echo)
MT: A Case Study • Middle temporal area of the macaque monkey • Sometimes also called V5 (5th visual area) • Meets all criteria for an area • Has an apparent human equivalent
MT: Function Single unit recording • Single neurons in MT are tuned to the direction of motion • Neurons are arranged in “direction hypercolumns” within MT cortex
MT: Function • Lesions • lesions to MT lead to deficits in perceiving motion • Microstimulation • stimulation of a neuron affects the perception of motion • e.g., if you find a neuron with a preference for upward motion, and then use the electrode to stimulate it, the monkey becomes more likely to report “upward” motion
MT Architecture • MT is stained with cytochrome oxidase (which indicates high metabolic activity)
MT Connectivity • MT receives direct input from V1 • largely from the “fast” magno pathway cells • MT projects to specific higher-level areas • MT is an intermediate level visual area
MT Topography • MT has a topographic representation of visual space + -
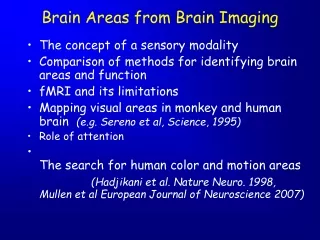
Tools for mapping human areas: function and topography • Neuropsychological Lesions • Temporary Disruption • transcranial magnetic stimulation (TMS) • Electrical and magnetic signals • electroencephalography (EEG) • magnetoencephalography (MEG) • Brain Imaging • positron emission tomography (PET) • functional magnetic resonance imaging (fMRI)
Tools for mapping human areas:architectonics and connectivity • Human architectonics • post-mortem analyses • high-resolution anatomical MRI • Human connectivity • diffusion tensor imaging (DTI) • resting state connectivity • TMS-induced network changes
How can we map human (visual) areas? • Look for homologues (or analogues) of known primate areas • Example: Human MT • Look for areas that may participate in highly enhanced human abilities • Example: Language, calculation, social interaction, tool use
Back to our case study: MT MT intermediate V1 A patient with bilateral lesions to MT can no longer perceive motion (Zihl et al., 1983) A temporary disruption to human MT interferes with motion perception (Beckers & Zeki, 1995)
fMRI of Human MT+ (V5+) Video: V1MTmovie.mpg Moving vs. stationary dots activates V1 and MT Flickering vs. stationary checkerboards activates V1
Topography of Human MT+ Huk, Dougherty & Heeger, 1002, J Neurosci
Why put the plus in MT+? MT MST Dukelow et al., 2001, J Neurophysiol not shown: divisions of MST, FST If you can’t distinguish the subdivisions, call it MT+
Cytoarchitectonics of MT+ Malicovik et al., 2007, Cereb Cortex
Probabilistic Cytoarchitectonics Malicovik et al., 2007, Cereb Cortex
DTI of MT+ Lanyon et al., 2009, J Neuro-Ophthalmol
Functional Connectivity of MT+ Sani et al., 2011, Frontiers in Systems Neuroscience
Evolutionary Relationships expected location actual location Macaque: superior temporal sulcus Human: inferior temporal sulcus
Macaque Retinotopy Source: Tootell et al., 1982
EXPANDING RINGS Retintopy: Flickering Checkerboard ROTATING WEDGES • 8 Hz flicker (checks reverse contrast 8X/sec) • good stimulus for driving visual areas • subjects must maintain fixation (on red dot)
EXPECTED RESPONSE PROFILE OF AREA RESPONDING TO STIMULUS STIMULUS time = 0 color code by phase of peak response time = 20 sec time = 40 sec 0 20 40 60 TIME time = 60 sec
Retintopy: Eccentricity calcarine sulcus left occipital lobe right occipital lobe • foveal area represented at occipital pole • peripheral regions represented more anteriorly
Retintopy on Flattened Occipital Lobe 1) virtually cut off the occipital lobe (remember, it’s a cup shape and the lateral surface is on the side we can’t see from this viewpoint) occipital pole 2) cut along calcarine sulcus upper calcarine sulcus lateral surface (note: retinotopic areas do extend onto the lateral surface but are not shown here in this schematic) 3) unfold and flatten the cortical surface occipital pole left occipital lobe lower calcarine sulcus
Retintopy: Eccentricity Movie calcarine sulcus occipital pole Movie: eccentricity.mpeg http://cogsci.ucsd.edu/~sereno/phasemovie2.mpg Source: Marty Sereno’s web page
Retintopy in V1: Polar Angle calcarine sulcus horizontal meridian (HM) VM VM HM HM VM VM left occipital lobe right occipital lobe vertical meridian (VM) • left-right hemifields reverse (left field to right hemisphere) • upper-lower hemifields reverse (upper field to below calcarine) • horizontal meridian lies ~along calcarine (not always exactly)
Polar Angle and Eccentricity in V1 calcarine sulcus left occipital lobe right occipital lobe • retinotopic areas are like polar coordinates: eccentricity and polar angle
} V3 } V2 upper VM HM } V2 lower } VP HM VM Polar Angle in V1, V2 and beyond calcarine sulcus } V1 upper horizontal meridian (HM) } V1 lower VM HM VM left occipital lobe vertical meridian (VM) • V2 is mirror image map of V1 • V1-V2 border occurs at vertical meridian • V2-V3 border occurs at horizontal meridian • situation gets more complex in higher-tier areas (V4v, V3A) that have representations of whole hemifield
Retinotopy Source: Sereno et al., 1995
Retinotopy: Polar Angle Movie calcarine sulcus occipital pole Movie: phase.mpeg http://zakros.ucsd.edu/~sereno/movies/phasemovie1b.mpg Source: Marty Sereno’s web page
Similarities Between Macaque and Human Maps Human Macaque (single neurons) (fMRI) Tootell et al., 1996, Trends Neurosci.
Getting Better Retinotopy • use stimuli appropriate to the area (e.g., motion in MT+, color in V4v) • use stimuli that are attentionally engaging
Other Sensory “-topies” Touch: Somatotopy Servos et al., 1998 red = wrist; orange = shoulder Audition: Tonotopy Sylvian fissure temporal lobe cochlea Movie: tonotopy.mpeg http://cogsci.ucsd.edu/~sereno/downsweep2.mpg Source: Marty Sereno’s web page
Saccadotopy • delayed saccades • move saccadic target systematically around the clock Source: Sereno et al., 2001 http://kamares.ucsd.edu/~sereno/LIP/both-closeup+stim.mpg Marty Sereno’s web page
Intraparietal Sulcus (IPS) Hagler & Sereno, 2006, NeuroImage Lateral Occipital (LO) Ventral Occipital (VO) There’s even maps in the frontal lobe
Maps, Maps, Maps Important Points: Maps are everywhere (the better our techniqes, the more maps we find) Some maps represent ¼ of the visual field (e.g., lower left visual field in green-blue, as in V1); some maps represent ½ of the visual field (e.g., left visual field in red-green, e.g., IPS0); some maps represent whole visual field (yellow too) Regardless of ¼ vs. ½-field representation, maps are always mirror images that flip at the horizontal meridian (blue; solid line) or vertical meridian (red-green; dashed line) Wandell et al., 2007, Neuron
Foveal Confluences one foveal confluence a separate foveal confluence Wandell et al., 2007, Neuron
Clustering of Areas foveal representation Wandell et al., 2007, Neuron