Download
1 / 45
450 likes | 585 Views
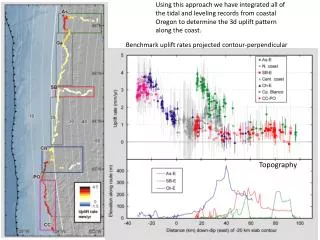
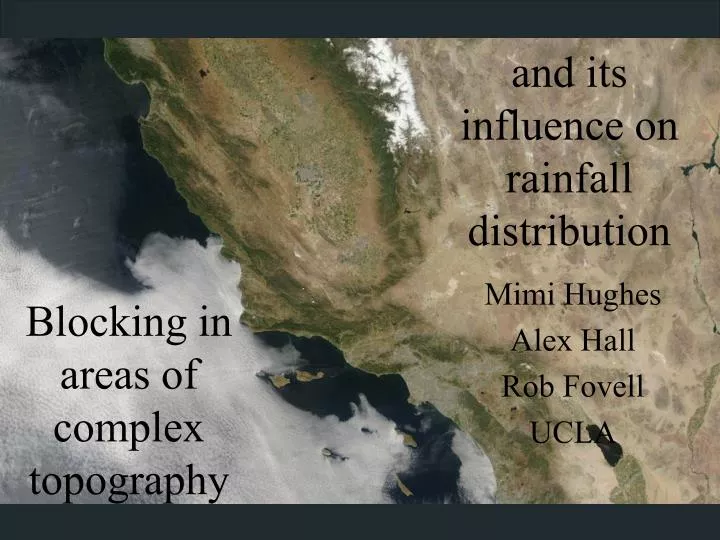
and its influence on rainfall distribution. Blocking in areas of complex topography. Mimi Hughes Alex Hall Rob Fovell UCLA. Rain in Southern California.

E N D
and its influence on rainfall distribution Blocking in areas of complex topography Mimi Hughes Alex Hall Rob Fovell UCLA
Rain in Southern California Orographic enhancement and blocking: heavy precipitation during Northern California New Year’s floods of 1997 was almost entirely due to the interaction of the flow with topography (see Galewsky and Sobel, 2005)
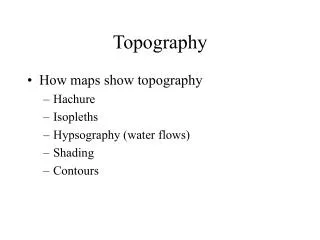
How can topography change the distribution of precipitation?
As air moves over topography it is forced to rise, causing moisture to condense and fall out: P: Precipitation qU: Moisture flux h(x,y): Terrain See Smith (1979), Roe (2005), etc. Wind Flow over? (mechanical lifting…) Precipitation (grayscale) and topography (contours) for an idealized numerical study. From Jiang (2003)
As air moves over topography it is forced to rise, causing moisture to condense and fall out: P: Precipitation qU: Moisture flux h(x,y): Terrain See Smith (1979), Roe (2005), etc. Wind Flow over? (mechanical lifting…) Is this too simple? Precipitation (grayscale) and topography (contours) for an idealized numerical study. From Jiang (2003)
Wind Or Flow around? (aka blocked flow) If the air approaching a barrier does not have enough kinetic energy to surmount it, the flow will be blocked (Smolarkiewicz and Rotunno, 1990; Pierrehumbert and Wyman, 1985). This can enhance precipitation upwind of the barrier. Precipitation (grayscale) and topography (contours) for an idealized numerical study. From Jiang (2003)
Case studies: Blocking influencing precipitation • Medina and Houze (2003) compared two synoptic events during the mesoscale alpine program and found a substantial difference in precipitation and wind between them. • Less stable, higher wind speed case => winds uniform with height and precipitation greatly enhanced on the windward slope • More stable, lower wind speed case => wind shear in the lowest layers and precipitation more evenly distributed • Neiman et. al. (2004) found that orographic blocking affected the propagation of the fronts during a storm from the 1997/98 season, substantially impacting the distribution of precipitation
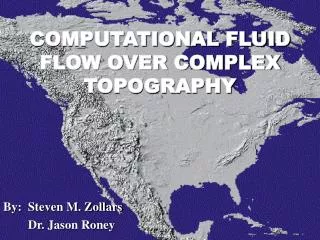
Motivation: To investigate what processes are essential to predicting the distribution of precipitation in complex topography Approach: Systematic study using a hierarchy of models
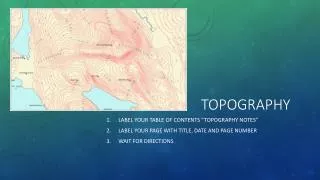
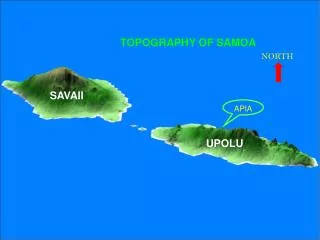
Topography Shuttle Radar Topography Mission elevation shown as shaded relief
Precipitation observations Cooperative Observation Precipitation measurements: average of daily rainfall from May 1995 to April 2006. Black contours show topography.
Winds during rain Vectors show wind speed and direction; colored contours show wind speed in m/s.
Coastal zone Cooperative Observation Precipitation measurements: average of daily rainfall from May 1995 to April 2006. Black contours show topography.
Upslope Model? Solid line shows linear regression. Large pale blue bullet is GPCP open-ocean average (119.5W-121.5W, 31.5N-32.5N)
Questions I’ll address… • Does orographic blocking occur during raining hours in Southern California? • Does blocking significantly impact the climatological distribution of precipitation? • Is there a simple way to get a quantitative estimate of the impact of blocking on precipitation?
MM5 Configuration • release 3.6.0 • boundary conditions: Eta model analysis • resolution: • domain 1: 54 km, domain 2: 18 km, domain 3: 6 km • 23 vertical levels. • time period: May 1995 to April 2006 (re-initialized every 3 days) • Parameterizations: • MRF boundary layer • Simple ice microphysics • Clear-air and cloud radiation • Kain-Fritsch 2 cumulus parameterization in coarse domains, only explicitly resolved convection in 6 km domain
MM5 Configuration • release 3.6.0 • boundary conditions: Eta model analysis • resolution: • domain 1: 54 km, domain 2: 18 km, domain 3: 6 km • 23 vertical levels. • time period: May 1995 to April 2006 (re-initialized every 3 days) • Parameterizations: • MRF boundary layer • Simple ice microphysics • Clear-air and cloud radiation • Kain-Fritsch 2 cumulus parameterization in coarse domains, only explicitly resolved convection in 6 km domain One can think of this as a reconstruction of weather conditions over this time period consistent with three constraints: (1) our best guess of the large-scale conditions, (2) the physics of the MM5 model, and (3) the prescribed topography, consistent with model resolution.
Model Validation: Precipitation
Model Validation: Precipitation Spatial Correlation: 0.87 Regression: slope = 1.13 intercept = 0.39 cm/month
Model Validation: Winds Correlation of simulated and observed daily mean wind anomalies at 18 stations. From Conil and Hall (2006)
Average open ocean wind speed Barrier height: 1 km Brunt-Väisälä frequency: Depends on the moisture content of the atmosphere. When not saturated: When close to saturation (Durran and Klemp, 1982): Computing a bulk Froude number
Separation by Fr2: Precipitation Composite maps of normalized precipitation rate for rainy hours binned by Fr2.
Separation by Fr2: Precipitation
How are the Froude number and the distribution of precipitation related?
High Fr2 Small N2 High U2 Adapted from Roe (2005)
Low Fr2 Large N2 Low U2 Adapted from Jiang (2003)
Separation by Fr2: Surface winds Vectors show wind speed and direction, normalized by open-ocean speed.
Separation by Fr2: Surface winds Vectors show normalized wind speed and direction; colored contours show normalized wind speed.
Separation by Fr2: Percentage of precipitation
Linear model of orographic precipitation Relates the precipitation to the gradient of the terrain, with the additional complexity of three shifting terms to account for upstream tilted vertically propagating gravity waves, and advection of water droplets during condensation and fallout. (Smith 2003, Smith and Barstad 2004)
Linear model of orographic precipitation In Fourier space:
Linear model of orographic precipitation Relates the precipitation to the gradient of the terrain, with the additional complexity of three shifting terms to account for upstream tilted vertically propagating gravity waves, and advection of water droplets during condensation and fallout. (Smith 2003, Smith and Barstad 2004)
In Fourier space: Where is the Fourier transform of the terrain. The inverse transform of gives the spatial distribution of precipitation once negative values are truncated and background rate is added. Linear model of orographic precipitation
Linear model: applied Precipitation distribution predicted by the Linear Model (LM) and the MM5 composite for the conditionally unstable hours.
Linear model: applied Spatial Correlation = 0.83 Precipitation distribution predicted by the Linear Model (LM) and the MM5 composite for the conditionally unstable hours.
Linear model: limitation Precipitation distribution predicted by the LM and the MM5 composite for the hours with lowest Fr2.
Extent to which blocking affects precipitation distribution Spatial correlation of the LM with MM5 precipitation for different ranges of Fr2
Extent to which blocking affects precipitation distribution Regression lines of MM5 precipitation/ slope relationship for different ranges of Fr2.
Summary We use a hierarchy of models to identify the processes essential for predicting precipitation distribution in complex topography. • Upstream blocking significantly modifies precipitation distribution in Southern California, contributing a substantial percentage of total precipitation, particularly at low elevation coastal locations. • Defining a bulk Froude number based on the ambient atmospheric conditions provides a useful measure of the extent to which blocking is affecting precipitation distribution. Exclusion of blocking effects is the main shortcoming of the linear model (LM), and including a term based on bulk Fr2 might make the LM accurate for all cases.
Applications • The large-scale Fr2 can constrain the relationship between slope and rainfall for use in: • Statistical downscaling techniques • Statistical interpolation schemes (e.g., PRISM) • Expect these findings to apply for other regions, particularly those which have complex topography next to a large region of moist but stable air (e.g., most of the coast of North America and the central coast of South America).
Future/Concurrent work Investigation of the large scale conditions associated with and local scale response to the Santa Ana Winds…