Download
1 / 16
170 likes | 407 Views
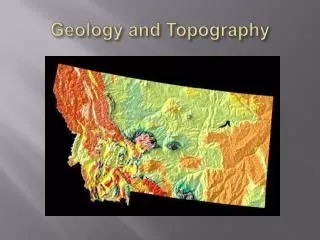
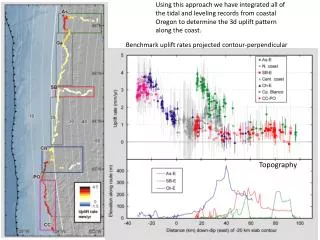
Topography and DEM. Modelling mountains. Topography and DEM. TIN: Vector model (Triangulated Irregular Network). History:Official elevation network had to be used for a 3D model, Can integrate different sources of data, Very flexible, can model even vertical or overhanging topography.

E N D
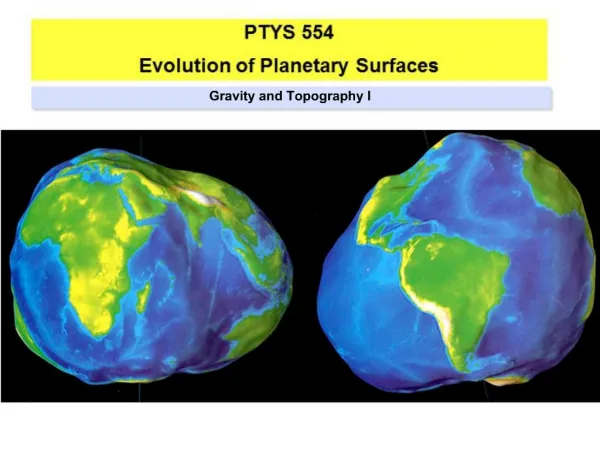
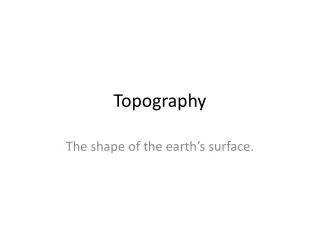
Topography and DEM Modelling mountains
Topography and DEM TIN: Vector model (Triangulated Irregular Network) • History:Official elevation network had to be used for a 3D model, • Can integrate different sources of data, • Very flexible, can model even vertical or overhanging topography INTAGRAF 2005 – Sabine Schmidt, “Topography and DEM”
Topography and DEM TIN: Vector model (Triangulated Irregular Network) INTAGRAF 2005 – Sabine Schmidt, “Topography and DEM”
Topography and DEM Raster model (DEM – Digital Elevation Model) • Data are sorted in a regular, quadratic grid • Ideal for scan-lines of satellites • Easy to treat / to implement • BUT • Contains redundant information in flat areas • can be very large! INTAGRAF 2005 – Sabine Schmidt, “Topography and DEM”
Topography and DEM Raster model (DEM – Digital Elevation Model) INTAGRAF 2005 – Sabine Schmidt, “Topography and DEM”
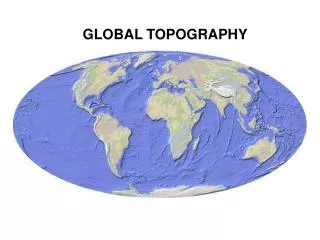
Topography worldwide GEBCO Ocean Mapping at Intergovernmental Oceanographic Commission (IOC) http://www.ngdc.noaa.gov/mgg/gebco/gebco.html Topography / bathymetry worldwide complete: 1 Minute academic license : 99 pound sterlingGTOPO30 U.S. Geological Survey's EROS Data Center a compilation of different raster and vector sources, completed in 1996Only onshore data, 30 seconds http://edcdaac.usgs.gov/gtopo30/gtopo30.aspftp://edcftp.cr.usgs.gov/pub/data/gtopo30/global/ DVD 78 $ FTP download free of charge SRTMShuttle Radar Topography Mission (NASA, U.S.G.S. EROS Data Center ) Only onshore data between 60° N and 56°S, 3 seconds, in the United States 1 second Satellite mission: Feb. 11th - 22nd 2000 http://srtm.usgs.gov/ FTP download free of charge INTAGRAF 2005 – Sabine Schmidt, “Topography and DEM”
Different spatial resolution INTAGRAF 2005 – Sabine Schmidt, “Topography and DEM”
SRTM Most frequently used data set Resolution: 3“ (approx. 90 meters)Height levels: 1 mCoordinates (datum) WGS84Error horizontal (relative): 15 m Error vertical (relative): 6 m available via ftp://e0mss21u.ecs.nasa.gov/srtm/or – using an input scheme - http://seamless.usgs.gov/Data format: .htg or .bil – binary format in files of 1 x 1 degree Contains data gaps- offshore- in water covered areas- in areas of rough topography INTAGRAF 2005 – Sabine Schmidt, “Topography and DEM”
The fixed baseline interferometry uses the traveltime difference between two radar beams, which are sent to the Earth, reflected at the surface, and then received by two antennas at a distance of 60 m. SRTM – The method I 60 m Figures from: http://srtm.usgs.gov/ INTAGRAF 2005 – Sabine Schmidt, “Topography and DEM”
SRTM – The method II Radar Holograms Radar Image Radar Image Interferogram + Phase Information + Phase Information Digital Elevation Model INTAGRAF 2005 – Sabine Schmidt, “Topography and DEM”
SRTM – data gaps Data Gaps (here marked red)exist in areas of rough topography or water covered areas.cause problems with- visualization- calculation of the topographic correction- volume and/or surface calculationsMay be filled bya) interpolation, orb) other data (gtopo30) INTAGRAF 2005 – Sabine Schmidt, “Topography and DEM”
SRTM - Vertical Error Flat map Shaded relief (vertical 6 m relative)causes severe problems in areas with flat topography INTAGRAF 2005 – Sabine Schmidt, “Topography and DEM”
Terrain Correction - Amounts INTAGRAF 2005 – Sabine Schmidt, “Topography and DEM”
Topographic correction onshore Histogram of topographic reduction values in percent. Values of histogram classes given in 10-5 m/s2. INTAGRAF 2005 – Sabine Schmidt, “Topography and DEM”
Topographic correction offshore Histogram of topographic reduction values in percent. Values of histogram classes given in 10-5 m/s2. INTAGRAF 2005 – Sabine Schmidt, “Topography and DEM”
Terrain Correction - Radius INTAGRAF 2005 – Sabine Schmidt, “Topography and DEM”