Download

1 / 23
230 likes | 375 Views
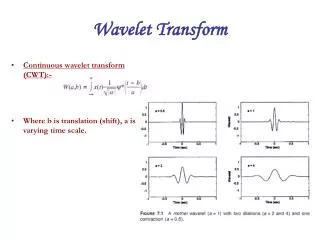
2-D Wavelet analyses on sinograms. CSE 5780 Medical Imaging Florida Institute of Technology Fall 2012. FREQUENCY ANALYSIS. Frequency Spectrum Be basically the frequency components (spectral components) of that signal Show what frequencies exists in the signal Fourier Transform (FT)

E N D
2-D Wavelet analyses on sinograms CSE 5780 Medical Imaging Florida Institute of Technology Fall 2012
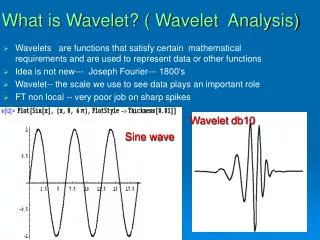
FREQUENCY ANALYSIS • Frequency Spectrum • Be basically the frequency components (spectral components) of that signal • Show what frequencies exists in the signal • Fourier Transform (FT) • One way to find the frequency content • Tells how much of each frequency exists in a signal
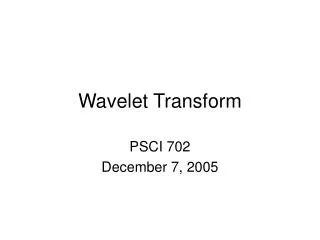
Different in Time Domain Magnitude Magnitude Magnitude Magnitude Time Frequency (Hz) Time Frequency (Hz) CHIRP SIGNALS Frequency: 20 Hz to 2 Hz Frequency: 2 Hz to 20 Hz Same in Frequency Domain At what time the frequency components occur? FT can not tell!
2-D Fourier analysis of the sinogram • Wavelet decompostion Matlab code : • clc; clear all; close all; • for indx=1:72 • [Y] = dicomread('demo', 'frames',indx); • figure(1) • subplot(2,3,1),imshow(Y,[]); • xlabel('Orginal DICOM image'); • A = (fft2(double(Y))); • [P,Q]=size(Y);
Applying Gaussian Filter in F-Domain • % step 2: Filtering the image in F-D by gaussian filter • H = gausslfilter(P,Q,5*i);% • A = H.*single(A); • % step 3: Display the results in F-D • subplot(2,3,4), imshow(log(1+abs(A)),[]); • xlabel('H X Image spectrum (2D fft)'); • subplot(2,3,3), imshow(log(1+abs(H)),[]); • xlabel('Gaussian Filter)'); • % step 4: apply 2D IFFt on each frame(takes the image from frequeency domain to • % spatial domain ) • A = ifft2(A); • % step 5: Display the results in spacial-D • subplot(2,3,5), imshow(abs(A),[]); • xlabel('Restored DICOM image (2D ifft)'); • end • pause(5) • end
Two-Dimensional Wavelets • For image processing applications we need wavelets that are two-dimensional. • This problem reduces down to designing 2D filters. • We will focus on a particular class of 2D filters: separable filters (Daubechies wavelets)
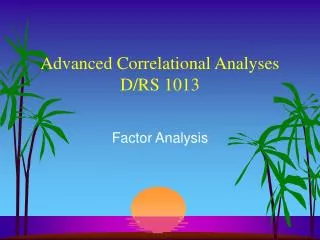
The Three Frequency Channels We can interpret the decomposition as a breakdown of the signal into spatially oriented frequency channels. Arrangement of wavelet representations Decomposition of frequency support
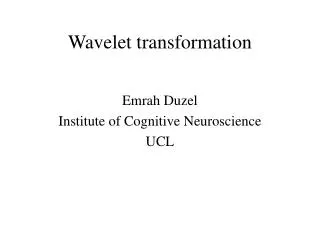
Wavelet decompostionMatlab code : • Three levels of 2D wavelet decompositions: [Y] = dicomread('demo', 'frames',indx) [a1,h1,v1,d1]=dwt2((Y),'db2'); plotting(a1,h1,v1,d1); [a2,h2,v2,d2]=dwt2((a1),'db2'); plotting(a2,h2,v2,d2); [a3,h3,v3,d3]=dwt2((a2),'db2'); plotting(a3,h3,v3,d3);
Filtering the high-high freq. Bank • d1=zeros(size(d1)); For the first level • d2=zeros(size(d2)); For the second level • d3=zeros(size(d3)); For the third level
Reconstruction Matlab code • a2=idwt2(a3,h3,v3,d3,'db2'); a1=idwt2(a2,h2,v2,d2,'db2'); recImage=idwt2(a1,h1,v1,d1,'db2');