Download
1 / 17
170 likes | 270 Views
Analyses on public investments. March 2007. TERRITORIAL ANALYSIS OF CALLS FOR TENDER. Aim: Integrated territorial analysis through calls for tender data. Solution: Analysis, definition of indicators and territorial representations. Increase 2005 over 2001. Decrease 2005 over 2001.

E N D
Analyses on public investments March 2007
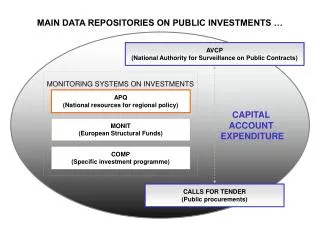
TERRITORIAL ANALYSIS OF CALLS FOR TENDER Aim: Integrated territorial analysis through calls for tender data Solution: Analysis, definition of indicators and territorial representations
Increase 2005 over 2001 Decrease 2005 over 2001 Data not available GROWTH OF CALLS FOR TENDER IN OBJ. 1 REGIONS Variation of per-capita amounts – 2005 over 2001 From 2001 to 2005 the total amount of calls for tender in Obj.1 regions INCREASED in 1.176 municipalities over 2.116 (56%),corresponding to 70% of population
PROPENSITY TO DEVELOPMENT AT TERRITORIAL LEVEL Development Propensity Index for calls tendered in year 0 CONSERVATION (maintenance, restoration, … ) 1 SVILUPPO (new construction, realization, … ) WORKS ONLY IN POWERPOINT 2000
DYNAMICS OF OVERALL PROPENSITY TO DEVELOPMENT (*) Computed on 58% of amounts in the year
DURATION INFLUENCING FACTORS Aim: Analysis of factors affecting the duration of a procedural step Solution: Binary Tree Analysis
Call for tender Awardingof contract Procurement Construction Activation Design Handover to contractor End of works Project in operation PROJECT LIFE-CYCLE
Call for tender Awardingof contract DURATION OF PROCUREMENT
Avg. duration 72 days PROCEDURE Restricted procedure Open tender YEAR OF TENDER PUBLIC BODY After 2001 52 days Until 2001 Ministries, Regions, Provinces,Municipalities Other AMOUNT YEAR OF TENDER SECTOR <= 4,3 Meuro > 4,3 Meuro 97 days After 2001 77 days Until 2001 104 days MACRO-AREA Social infr., Environ., Other Transportation 150 days North 64 days Centre, South, Islands YEAR OF TENDER SECTOR After 2001 106 days Until 2001 124 days Social infr., Environ., Other 70 days Transportation 79 days
FORECASTING SYSTEM OF THE EXPENDITURE Aim: Leading information on the expenditure Solution: Forecasting system analysis
TOOLS FOR INTEGRATON OF FORECASTS The outcome of the neural network is an optimal and dynamic selection of the most accurate forecast.
DYNAMIC MAP OF EXPENDITURE Expenditure forecast for year Total yearly expenditure WORKS ONLY IN POWERPOINT 2000 The dynamics of the expenditure can be represented at municipal level
SCENARIO BUILDING Different assumptions on the composition of a set of projects lead to the definition of different expenditure scenarios
PERFORMANCE ANALYSIS Aim: Compare performances among projects and among public bodies Solution: Definition of benchmarks and graphical representation
PROJECT PERFORMANCES Expend. index IN AVERAGE The selected project is compared with all the other projects (dashed circle) and with those sharing the same features (beams) at the same time
PUBLIC BODY PERFORMANCES Percentage of implementation Expected end of works Public bodies with projects with greatest costs (size of bubbles) have smallest implementation percentage and will be ended latest