Download

1 / 57
570 likes | 668 Views
Dispersion of microbes in water distribution systems. Chris Choi Department of Agricultural and Biosystems Engineering The University of Arizona. CAMRA – National Homeland Security Center. Michigan State University. The University of Michigan. The University of California, Berkeley.

E N D
Dispersion of microbes in water distribution systems Chris Choi Department of Agricultural and Biosystems Engineering The University of Arizona
CAMRA – National Homeland Security Center Michigan State University The University of Michigan The University of California, Berkeley Drexel University Northern Arizona University Carnegie Mellon University The University of Arizona Main Research Focus of Choi’s Group: Water Distribution Systems
CAMRA – National Homeland Security Center UA’s Research ResponsibilitiesExposure, Detection, Fate and Transport of Agents - The goal is to improve our ability to quantify exposure to biological agents of concern (Category A and B agents) in drinking water systems and indoor air environments.
Proposed Research Plan RISK ASSESSMENT • EPANET-based Simulation • HD Model • - WQ Model ANN-based Prediction Models Indicator Microorganisms (Gerba et al.) Experimental Validation using Water-Distribution Networks at the Water Village
Collaboration Plan Utilities (Tucson Water) National Laboratories (Sandia National Laboratories) EPA Water Distribution Laboratory Bio-sensor Researchers Quantitative Microbial Risk Assessment Private Companies (Hach Event Monitor and Bio-Sentry) Microbiology (Dr. Gerba’s Laboratory) Accurate data sets are essential!
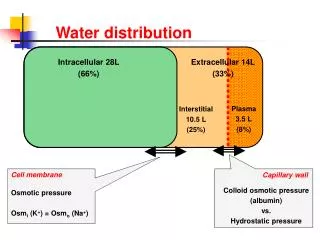
What is EPANET? EPANET models the hydraulic and water quality behavior of water distribution piping systems. EPANET is a ‘free & open source’ Windows program written in C & Delphi programming languages that performs extended period simulation of hydraulic and water-quality behavior within pressurized pipe networks. A network can consist of pipes, nodes (pipe junctions), pumps, valves and storage tanks or reservoirs. A “Node-to-Node” macroscopic Approach – Remember the cube Prof. Hass Introduced. Node j Node i 2D Control Volume 3D Control Volume 1D Control Volume
EPANET is one of many WDS tools Ref @ Angel Website:
Vulnerability of Water Distribution Systems What if… Fire Hydrant contaminants $ 100 pump without backflow prevention devices
Lab visits Serious Engineering and Sensor Research Efforts by Various Organizations: Example at an EPA Lab in Cincinnati
City of Tucson Water Distribution Network UA & Downtown Area
Exemplary Case Univ. of Arizona Intrusion Water In Water Distribution Network near the University of Arizona Campus
Sample Water Distribution Network Perfect Mixing Assumed at the Cross Joint for Modeling Tools to Subdivision A to Subdivision B 50 % 50 % Biological Agent Intrusion Point Water In to Subdivision C
Perfect Mixing Assumption C = 0.5? Un-contaminated Water (C = 0) C = 0.5? Contaminated Water (C = 1)
Perfect Mixing Assumption C = 0.15 Un-contaminated Water (C = 0) C = 0.85 Contaminated Water (C = 1) Courtesy of Sandia National Laboratories
How to correct this problem? Computational Approach – CFDExperimental ApproachUnderstanding of Fluid Mechanics (turbulent flow, in particular) and Transport Phenomena
Laminar & Turbulent Flow in Pipes Experiment conducted by Osborne Reynolds (1842 - 1912) Re<2100, laminar flow Re>2100, turbulent flow
CFD Procedure Discretized Governing Equation 2D Control Volume Each box a infinitesimal control volume Discretization
Turbulent Flow Navier-Stokes equations should apply, but this is not usually solvable for random and inherently unsteady (in a small scale) turbulent flows. Suggested approach: to time-average the N-S equations and look at the effect of the unsteady turbulent motions: Reynolds’ Equation Introduce & Ref @ Angel Website:
Governing Equations for Turbulent Flow(based on k-e model) where
Key Parameters Re = f(Flow Speed)0 < Re < 60,000+
Key Parameters Turbulent Schmidt Number (Sct) In a k-ε turbulent model, total diffusivity is composed of the molecular and eddy diffusivities. The eddy diffusivity is calculated through the turbulent Schmidt number. Therefore, eddy diffusivity is directly proportional to the eddy viscosity computed at each node and inversely proportional to Sct. (Laminar Flow)
Preparation of Sensors, Pumps, and Dataloggers for Water Distribution Network Laboratory
Complex Oscillatory Flow Patterns Depending Upon Flow Speed Concentration Profiles Velocity Vectors
Lagrangian Particle Trajectories Mixing patterns along the interface
The Water Village Unit B: Water Distribution Network Lab Water Quality Center Environmental Research Laboratory Mesquite Bosque Data & Education Building Unit A: Microbiology Lab Rainwater Catchment Edible Garden Water Quality Laboratory Project Office Oasis Garden Visitor Parking Tucson International Airport Xeriscape Gardens Main Office
A schematic of the experimental setup • Saltwater Tank • Pump • Gate Valve • Electrical Conductivity Sensor • Flow Sensor • Freshwater Tank.
Complexities & Three Scenarios Scenario 1: Equal inflows and outflows (ReS = ReW = ReN = ReE) Scenario 2: Equal outflows, varying inflows (ReS ≠ ReW , ReN = ReE) Scenario 3: Equal inflows, varying outflows (ReS = ReW , ReN ≠ ReE)
Comparison – An Example NaCl mass rate splits from the experimental, numerical and water quality model outcomes at different ReE/N (East Outlet), when ReS = ReW and ReE ≠ ReN.
Correction & Generalization Numerical Results based on Revised Sct Dimensionless concentration of the experimental and numerical results with corrected Turbulent Schmidt Number (Sct) for the East Outlet when ReS ≠ ReW and ReE = ReN.
Revision of Water Distribution Model CFD simulations based on four Reynolds numbers at each node with Sct= 0.135 Revise EPANET using C programming language based on CFD results
Comparison Current WDS Model Improved WDS Model