Download
1 / 9
90 likes | 180 Views
Supplemental Figure 1. 0. LNCaP/Luc/PHB-siRNA. b. No Dox No DHT. No Dox No DHT. No Dox + DHT. *. No Dox + DHT. 20. 1.4. PHB-RNAi No DHT. PHB-RNAi No DHT. *. PHB-RNAi + DHT. PHB-RNAi + DHT. 1.2. *. 15. 1. *. Fold Enrichment of AR. 0.8. Fold Enrichment of PHB. 10. 0.6. 0.4.

E N D
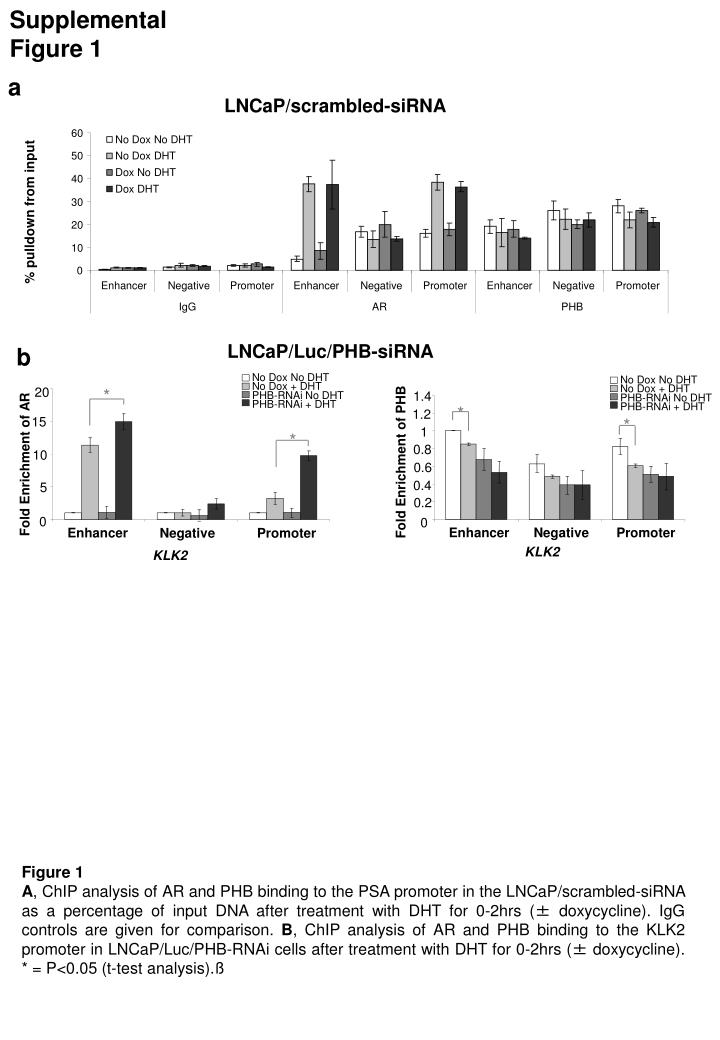
Supplemental Figure 1 0 LNCaP/Luc/PHB-siRNA b No Dox No DHT No Dox No DHT No Dox + DHT * No Dox + DHT 20 1.4 PHB-RNAi No DHT PHB-RNAi No DHT * PHB-RNAi + DHT PHB-RNAi + DHT 1.2 * 15 1 * Fold Enrichment of AR 0.8 Fold Enrichment of PHB 10 0.6 0.4 5 0.2 0 0 Enhancer Negative Promoter Enhancer Negative Promoter KLK2 KLK2 a LNCaP/scrambled-siRNA 60 No Dox No DHT 50 No Dox DHT Dox No DHT 40 Dox DHT % pulldown from input 30 20 10 Enhancer Negative Promoter Enhancer Negative Promoter Enhancer Negative Promoter IgG AR PHB Figure 1 A, ChIP analysis of AR and PHB binding to the PSA promoter in the LNCaP/scrambled-siRNA as a percentage of input DNA after treatment with DHT for 0-2hrs (± doxycycline). IgG controls are given for comparison. B, ChIP analysis of AR and PHB binding to the KLK2 promoter in LNCaP/Luc/PHB-RNAi cells after treatment with DHT for 0-2hrs (± doxycycline). * = P<0.05 (t-test analysis).ß
Supplemental Figure 2 Enhancer Promoter 10 10 8 8 6 6 No Dox No Dox +RNAi +RNAi 4 4 2 2 0 0 T0 15 30 60 120 T0 15 30 60 120 Time after DHT treatment Time after DHT treatment b 16 1.2 No Dox No Dox PHB RNAi PHB RNAi 14 1 12 0.8 10 0.6 8 6 0.4 4 0.2 2 0 0 0 15 30 60 120 240 0 15 30 60 120 240 Time (min) after DHT treatment Time (min) after DHT treatment 1.2 6 No Dox No Dox PHB RNAi PHB RNAi 1 5 0.8 4 PHB enrichment (fold increase) PHB enrichment (fold increase) 0.6 3 0.4 2 0.2 1 0 0 0 15 30 60 120 240 0 15 30 60 120 240 Time (min) after DHT treatment Time (min) after DHT treatment 5 5 No Dox No Dox PHB RNAi PHB RNAi 4 4 IgG enrichment (fold increase) IgG enrichment (fold increase) 3 3 2 2 1 1 0 0 0 15 30 60 120 240 0 15 30 60 120 240 Time (min) after DHT treatment Time (min) after DHT treatment Taqman PCR IgG Control a Enrichement due to IgG Enrichement due to IgG Enhancer Promoter AR enrichment (fold increase) AR enrichment (fold increase) Figure 2 A, ChIP analysis of the PSA promoter and enhancer regions with a control rabbit IgG antibody, in LNCaP/Luc/PHB-siRNA cells treated with DHT over 0-2hours. B, ChIP analysis of AR and PHB binding (and IgG control) to the KLK2 promoter in the LNCaP/Luc/PHB-siRNA cells after treatment with DHT for 0-4hrs (± doxycycline).
Supplemental Figure 3 10 * 9 8 0 7 20 * 6 40 Fold Increase in Expression 5 * 60 4 120 3 240 2 480 1 0 No dox + RNAi No dox + RNAi KLK2 TMPRSS2 a Time after treatment (min) b DHT Androstenedione 4 4 No Dox No Dox PHB-RNAi PHB-RNAi 3 3 Luciferase expression (foild increase) Luciferase expression (foild increase) 2 2 1 1 0 0 nM DHT nM ASD 0 1 10 0 1 10 0 1 10 0 1 10 pcDNA4-Empty pcDNA4-PHB wt pcDNA4-Empty pcDNA4-PHB wt Figure 3 A. Taqman RT-PCR analysis of KLK2 and TMPRSS2 transcript levels collected at time intervals (0 – 8hr) from starved LNCaP/Luc/PHB-RNAi cells treated with 10nM DHT. ** = P<0.01, * = P<0.05 (t-test analysis). B, AR-mediated luciferase expression from LNCaP/Luc/PHB-siRNA cells treated with DHT or Androstenedione (0-10nM) for 24hrs (± doxycycline), transiently transfected with either empty pcDNA4 or pcDNA expressing PHB-cDNA coding region which is not targetted by PHB-RNAi.
Supplemental Figure 4 a DHT Androstenedione 5 No Dox 5 No Dox Dox Dox 4 4 3 3 2 2 1 1 0 0 Starved 1 2 4 6 8 16 Starved 1 2 4 6 8 16 Time after treatment (hrs) Time after treatment (hrs) LNCaP/ pcDNA4/TO Empty Vector 6 No Dox 6 No Dox Dox Dox 5 5 4 4 3 3 2 2 1 1 0 0 0.01 0.1 1 10 100 0.01 0.1 1 10 100 DHT concentration (nM) Androstenedione concentration (nM) PSA Fold Increase PSA Fold Increase b PSA Fold Increase PSA Fold Increase c LNCaP/pTER Scrambled Vector 6 6 No Dox No Dox Dox Dox 5 5 4 4 PSA Fold Increase PSA Fold Increase 3 3 2 2 1 1 0 0 0.01 0.1 1 10 100 0.01 0.1 1 10 100 Androstenedione concentration (nM) DHT concentration (nM) Figure 4. A, Taqman RT-PCR analysis of PSA transcript levels collected at time intervals (0-16hrs) from starved LNCaP/Luc/scrambled-siRNA cells treated with 10nM DHT or androstenedione. B, Taqman RT-PCR analysis of PSA transcripts from starved LNCaP/Luc/pcDNA4/TO-Empty cells treated with 0-100nM DHT or androstenedione. C, Taqman RT-PCR analysis of PSA transcripts from starved LNCaP/Luc/scrambled-siRNA cells treated with 0-100nM DHT or androstenedione.
Supplemental Figure 5 PHB-cDNA PHB-RNAi Figure 5. Scatchard analysis of [3H]-mibolerone binding to the AR in LNCaP/Luc/PHB-cDNA and RNAi cells. Binding maximum (Bmax) and dissociation constant (kd) are given for each cell line in the table.
Supplemental Figure 6 a 25 20 15 Gene expression (fold increase) Eth DHT 10 5 0 TAP1 b-actin Cyc D PSA b No Dox 1.5 PHB RNAi Gene expression (fold increase) 1 0.5 0 b-actin TAP1 Cyc D Caspase 7 YY1 TK1 c 1.6 1.4 1.2 1 TAP1 expression (fold increase) 0.8 0.6 0.4 0.2 0 - gIFN + gIFN - gIFN + gIFN No Dox PHB RNAi Figure 6. A, Taqman RT-PCR analysis of TAP1, b-actin, CyclinD and PSA transcripts from starved LNCaP cells treated with 10nM DHT or ethanol. B, Taqman RT-PCR analysis of b-actin, TAP1, Cyclin D, Caspase 7, YY1, TK transcript levels collected from LNCaP/Luc/PHB-RNAi cells (± doxycycline). C, Taqman RT-PCR analysis of TAP-1 transcripts from LNCaP/Luc/PHB-RNAi cells treated with 100U/ml g-IFN for 6hours.
Supplemental Figure 7 + DNase DNA Marker No DNase + Dox (PHB RNAi) Increased DNase sensitivity Figure 7. Ethidium bromide stained gel electrophoresis showing motility of DNA extracted from LNCaP/Luc/RNAi cells treated with increased amounts of doxycycline for 24hr and subjected to DNase digestion.
Supplemental Figure 8 3 1.2 2.5 1 2 Fold change 0.8 EthOH Fold change 1.5 DHT 0.6 1 0.4 0.5 0.2 0 0 Scrambled PHB-siRNA Scrambled PHB-siRNA PSA PHB 100 % expression of PHB (relative to LNCaP) 50 LNCaP VCaP Du145 C42 C42b Cell Line a b Figure 8. A, Taqman RT-PCR analysis of PHB transcript levels from LNCaP, VCaP, C42, C42b, Du145 and MCF-7 cells, normalized via absolute quantification against a standard curve generated using purified PHB RNA. B, Taqman RT-PCR analysis of PHB and PSA levels from starved VCaP cells treated with PHB-siRNA for 48hours and treated with DHT for 24hours, normalized to L19. In each case data represent mean of triplicate experiment and are representative of 2 or more independent experiments.
Supplemental Table 1 PCR primers for ChIP PSA Promoter Promoter (AREI) FOR 5’-TCTGCCTTTGTCCCCTAGAT-3’ REV 5’-GCTAGCACTTGCTGTTCTGC-3’ Promoter (AREII) FOR 5’-AGGGATCAGGGAGTCTCACA-3’ REV 5’-GCTAGCACTTGCTGTTCTGC-3’ Negative 1 FOR 5’-CTGTGCTTGGAGTTTACCTGA-3’ REV 5’-GCAGAGGTTGCAGTGAGCC-3’ Negative 2 FOR 5’-AGGGTATCACCAGCCCTTCT-3’ REV 5’-GAGGATGTCGGCAGCTCTAC-3’ Enhancer (AREIII) FOR 5’-ACAGACCTACTCTGGAGGAAC-3’ REV 5’-AAGACAGCAACACCTTTTT-3’ Upstream 1 FOR 5’-TTTAGGGCTTCCCAAGATGA-3’ REV 5’-TGTCACCGGGAAAAGAAAAC-3’ Downstream FOR 5’-CTGTGAGTGCCCAACCCTAT-3’ REV 5’-CTGGGGATGCTCATGTTTTTC-3’ Taqman PCR primers for ChIP PSA Promoter PSA negative For 5’-TCCACTCCAGCTCTAAGATGGT-3’ PSA negative Rev 5’-CAGGTAAACTCCAAGCACAGTGA-3’ PSA negative probe 5’-FAM-CAGAGGTGGATATAGATAATC-3’ PSA promoter For 5’-GTGCATCCAGGGTGATCTAGTAATT-3’ PSA promoter Rev 5’-CACACCCAGAGCTGTGGAA-3’ PSA promoter probe 5’-FAM-CTAGCACTTGCTGTTCTGC-3’ PSA enhancer For 5’-TGACAGTAAACAAATCTGTTGTAAGAGACA-3’ PSA enhancer Rev 5’-AGCAGGCATCCTTGCAAGAT-3’ PSA enhancer probe 5’-FAM-CCAGGCTTGCTTACTGTC-3’ Primers for Other Gene Promoters (ChIP) KLK2 Enhancer For 5’-TTTATAATTGGGTTGAAAGCAGACCTA-3’ Rev 5’-AGCAGATTTGTTTACTGTTCAGGACA-3’ KLK2 Negative For 5’-TGGGTGATGTGGTTGGATTGG-3’ Rev` 5’-CCCATGATAACCTCAACCAAAACCT-3’ KLK2 Promoter For 5’-GCCTCCAGACTGATCTAGTATGTGT-3’ Rev 5’-CACACCCAGAGCTGTGGAA-3’ b-actin promoter region 1 For 5’-AAGGCAACTTTCGGAACGG-3’ Rev 5’-TCCTCTTCCTCAATCTCGCTCTC-3’ b-actin promoter region 2 For 5’-GAGCTCTTGGAGGGCATGGA-3’ Rev 5’-CTCTACCTCTCAAGCCCAGGT-3’ TAP1 promoter (STAT binding region) For 5’-AACTGGTGCAAGTGGAAAGG-3’ Rev 5’-GCCAGAAGCTCAGCCATTTA-3’ Cyclin D Region A For 5’-CTCCACCTCACCCCCTAAATC-3’ Rev 5’-AGAGCCCAAAAGCCATCC-3’ Cyclin D Region C For 5’-CCGACTGGTCAAGGTAGGAAG-3’ Rev 5’-ACAACCCCTGTGCAAGTTTC-3’ Table 1: A list of the primer sets used for the ChIP analysis PCR for PSA, KLK2, ß-actin, TAP1 and CyclinD1 gene promoters.