Download
1 / 21
240 likes | 736 Views
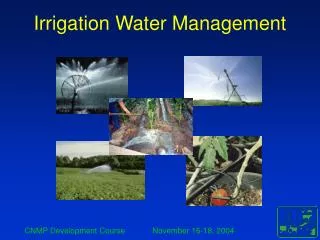
Irrigation Management for Nursery Production. IAL Conference June 2014. by John McDonald Industry Development Manager (NGIQ). Research & Development. Researching the application, absorption and use of irrigation water in container plant production

E N D
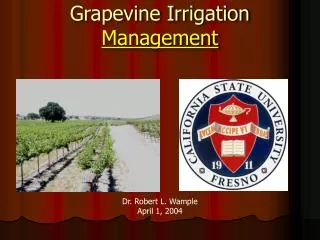
Irrigation Managementfor Nursery Production IAL Conference June 2014 by John McDonald Industry Development Manager (NGIQ)
Research & Development • Researching the application, absorption and use of irrigation water in container plant production • Utilising the best science to assess what are the water use processes within the container • Apply the best technology to use what we discovered for application at the grower level • 7 years of on-farm assessment in QLD
Presentation will address: • Why did we do it? • What did we do? • How did we do it? • What results came out of it? • What does it mean?
Why did we do it? • Impact on plant production • Droughting • Water logging • Fertiliser leaching • Cost of irrigation water delivery • Energy $$$ • Irrigation water availability • Increasing cost • Pressure on access & volumes • Plant production costs • Dispatch • Labour • Industry statistics • irrigate 4.5 times longer than required • twice the amount of water that can be used • delivery uniformity 75% of optimum
Water Saving by System Change Data from production nurseries in regional Queensland 2012/2013
Energy Saving by Irrigation Efficiency • Installation of a recycling system reducing energy • Review schedules to increase time between irrigation and increased drawdown of available water • Conversion of growing area to drip irrigation • Improved scheduling • Changes to scheduling method • Improved scheduling and rationalisation of growing areas • Rationalisation of growing areas • Improved irrigation layout • Upgrading pump technology to variable speed pumping
Average Gains from Improving Irrigation Systems Data from South East Queensland production nurseries (n = 24) 2012/2013 32% 20%
What did we do? • Investigated available ‘soil’ moisture technology • Tensiometers • Capacitance probes • Volumetric moisture probes • etc • Assessed the technology against: • Effectiveness in measuring moisture content • Ability to link to controllers for automation • Availability of units in Australia • Cost of units in Australia RESULT Identified NEW technology was required
How did we do it? • Investigated loadcell technologies used for gravimetric weighing in other sectors - research, weigh bridges, etc. • Designed and conducted a proof of concept trial investigating weight based irrigation scheduling (WBIS) using loadcells (Stage 1) • Expanded the proof of concept trial to establish a larger trial to investigate WBIS against common scheduling methods of timed and ET (Stage 2)
How did we do it? • Established a research trial to measure and assess the process of application, absorption and use of irrigation water in container plant production plus the ability to develop a self learning algorithm to accommodate root and vegetative growth impacts on weight and water absorption (Stage 3) • Completed the final controlled phase to test all aspects of the research and provide final data prior to field trials (Stage 4) • Implementing a field trial to test the research at a field level under normal operating conditions (Stage 5)
What are the results? • Weight Based Irrigation Scheduling: • can be applied and is effective • out performs common irrigation methods of: • timed irrigation (set run times/season) • evapotranspiration (ET) scheduled • can be automated to provide real time data • can be operated via an irrigation controller • can use a representative sample of the crop
What are the results? WBIS applies 30% – 40% less water over a cropping cycle Prototype controller error
Rain event at 12:30 pm increasing the Timed and ET zone weights followed by an irrigation event the next morning. Rain event not shown in WBI zones due to CC determination the previous day. Timed irrigation occurring daily but overall container weight gradually reducing due to excessive evapotranspiration over several days. No irrigation container weigh drops No irrigations for 2 days due to zero ET loss then irrigations starting as ET losses increase. Container weight still dropping until rain event. Container capacity irrigation event Rain event at 12:30 pm increasing the Timed and ET zone weights followed by an irrigation event the next morning. Rain event not shown in WBI zones due to CC determination the previous day. No irrigations for 3 days until irrigation trigger weight is reached then again 2 days later.
What does it mean? • Automatic irrigation scheduling based on plant water use is achievable • Three key resources are required: 1. A weighing platform (loadcells) for field placement • Waterproof and connected to a controller 2. An electronic irrigation controller • Capable of interpreting weight based data • Includes common controller features • Multiple stations, frost control, multiple start/stop timers, etc 3. Knowledge of plant water use (high/medium/low) • Group like water users (crops) together from experience • Use a database that groups plants by water use
WBIC monitoring screen for total container weight, note the high alarm due to excessive rainfall WBIC screen showing trigger points percentages for the water content method and the volume of water in the container.
WBIC - Components WBIC - Loadcell WBIC node connects loadcells to WBIC
Determining Container Capacity Change Container Capacity (CC) irrigation event is scheduled at 25 day intervals – irrigation water is applied until container stabilises at a constant weight then shuts down. The WBIC establishes this as the new CC weight and adjusts percentages for re-fill and stop points by the same percentage as the water holding capacity that is lost.