Download

1 / 12
120 likes | 194 Views
Quadratics and area investigation. By Maeve dodd. Scenario.

E N D
Quadratics and area investigation By Maeve dodd
Scenario You have just bought a plot of land in the country and are looking to build a small cottage . The perimeter of your land is 120 meters and is set with increments of 5. In order to build a decent sized house, you must figure out how to make the most of the plot of land you now own.
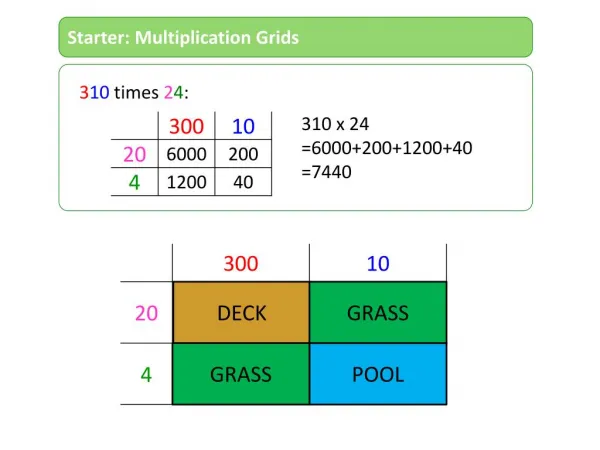
Part A- Concepts & procedures 40m 30m 1. 20m 30m 20m 50m 10m 40m
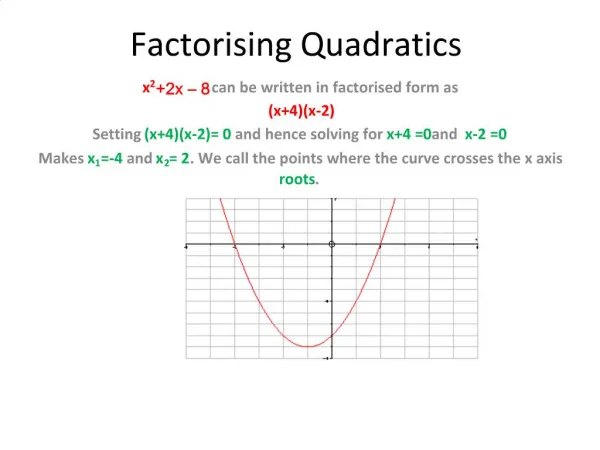
4. The maximum area for your rectangle is 900m2with the dimensions 30x30. You can determine this by looking at the table and/or the coordinates of the highest point on the graph which is (30;30) meaning 30x30=900m2 or the fact that this particular rectangle is actually a square tells us that it has the maximum area as well 5. The reason you would want to know the maximum area of your rectangle is so that you can make the most of the perimeter you must use.
6. Most Y values have 2 X values except 900m2which has only one X value of 30. This is the case because when the line on a graph is an arc shape called a parabola, then most Y values intersect it twice. This is an example of a function because one input (x) must have only one output (y) but an output can have more than one input value.
7. As the length of the side increases, so does the area up until the maximum value of the area after which a further increase in the length causes a decrease in the area. We graph a length of a rectangle against the area and exclude the width because the length of a rectangle can easily become the width and vies versa, like in the example below: 20m 40m 40m 20m
Part b- Problem solving A. Express the width in terms of length
B. Write an equation for the area using A and L as your only variables The negative coefficient next to L2 makes the arc shaped line on the graph face down like this: as opposed to this:
C. Checking for reasonableness Both answers were correct meaning that the formula found is accurate.