Download
1 / 16
160 likes | 258 Views
Quadratics and Area Investigation. By Atishi Gupta, kieren Jessop, vani melwani. The Official Separation of Latveria .

E N D
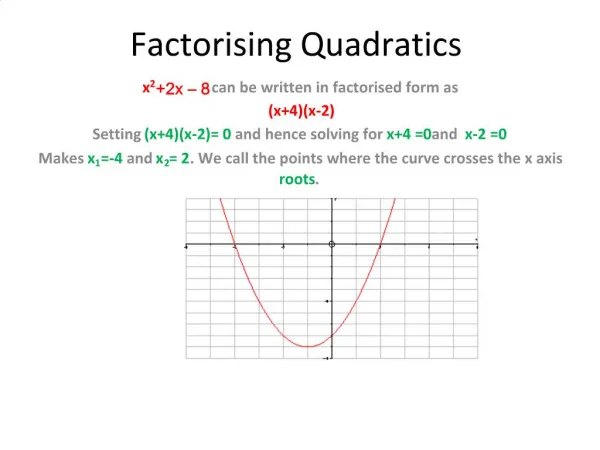
Quadratics and Area Investigation By Atishi Gupta, kieren Jessop, vanimelwani
The Official Separation of Latveria We have been given a 120m perimeter of former Latverian soil to call our own. We have to make the most of the area in this fixed perimeter to help our small but great country of North Latveria prosper, and show the South Latverians that we are better than them. During the Latverian revolution the government tried to defeat the rebels by giving them a solution which causes them to have major OCD (Obsessive Compulsive Disorder) resulting in the panic that the dimensions of this new land would not be a multiple of five. To fix this problem we have made sure that the dimensions of the land are multiplies of five.
4) The Maximum Area 900m2. We determined this by looking at the table above. Another way to do this was to keep the length and width of the perimeter the same, and get the largest area possible of that perimeter.
5) Why would we want to know the maximum area? So that we can have the most efficient area possible for the new people of the Latverian community.
6) How many x’s and y’s? Every plot on the y-axis has a doppelganger that is exactly opposite to it. This is because after the maximum the length and width are switched around. Two x’s and two y’s. Because most of the y’s have two x values.
7) The Pattern We notice that as the arc of the graph in number 5) decreases from the maximum point (900m2), the lengths are actually widths of previous lengths from before the maximum point. We exclude the width and only graph the length and area of the rectangle because we can find the width by dividing the area by the length.
1) The Width in Terms of Length P = (l + w) 120 = 2(l + w) 120/2 = (l + w) 60 = (l + w) 60 – l = w 60 – l = w w = 60 - l
2) Equation A = l (60 – l) w = 60-l , so instead of using w in the equation, we used 60-l instead.