Download
1 / 48
480 likes | 569 Views
Transformations, Quadratics, and CBRs. Jerald Murdock Jmurdock@traverse.com www.jmurdock.org. Based on the Discovering Algebra Texts–Key Curriculum Press. Investigation-based learning Appropriate use of technology Rich and meaningful mathematics

E N D
Transformations, Quadratics, and CBRs Jerald Murdock Jmurdock@traverse.com www.jmurdock.org
Based on the Discovering Algebra Texts–Key Curriculum Press • Investigation-based learning • Appropriate use of technology • Rich and meaningful mathematics • Strong connections to the NCTM Content and Process Standards
-6.2 ≤ y ≤ 6.2 -9.4 ≤ x ≤ 9.4 Begin by transforming a figure L1 L2 1 1 3 5 5 4 3 3 4 1 We’ll plot this figure in L1 and L2 and the transformed image in L3 and L4.
L3 = L1 – 8, L4 = L2 L3 = L1, L4 = L2 – 6 L3 = L1 – 5, L4 = L2 – 3 Show both original figure and image slide the figure left 8 units. 2. slide the original figure 6 units down. 3. slide the original figure down 3 units and left 5 units.
L3 = L1, L4 = - L2 L5 = - L1, L6 = - L2 L3 = L1 – 5, L4 = 0.5 L2 – 3 Show pre-image and image 4. Reflect figure over the x-axis. Reflect the resulting figure over the y-axis. 6. Shrink the original figure vertically by a factor of 1/2, translate the result 3 units down and left 5 units.
An Explanation •To translate a figure to the left 5 units • New x list = old x list – 5 • To translate a figure to the right 3 units • New x list = old x list + 3 • To slide a figure 6 units down • New y list = old y list – 6 • To reflect a figure over the x-axis • New y list = - (old y list) • To vertically stretch a figure by factor k • New y list = k(old y list)
xpipe.sourceforge.net/ Images/RubicsCube.gif Step by step transformations get the Job done
Create this transformation a solution L3 = - L1 – 3 L4 = - L2 + 4
“I’m very well acquainted, too, with matters mathematical.I understand equations both the simple and quadratical.About binomial theorem I am teeming with a lot of news. . .With many cheerful facts about the square of the hypotenuse!” The Major General’s Song from The Pirates of Penzance by Gilbert and Sullivan
Transformations of Functions -3 -2 -1 1 2 3
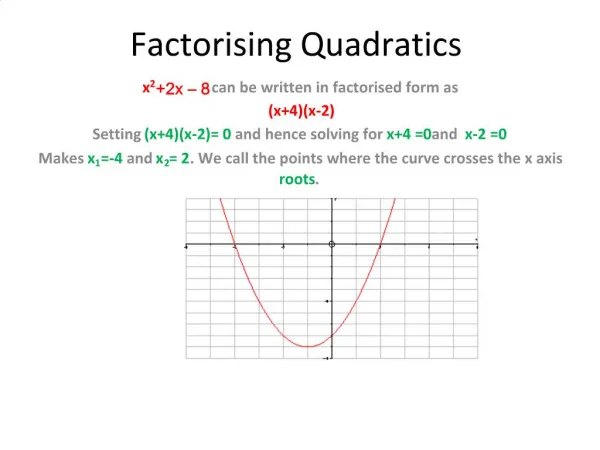
Original equation y = x2 • • To move a function to the right 3 units new x = old x + 3 • or old x = new x – 3 • To move a function 3 units right we must replace the old x in the original equation with x – 3.y = (x – 3)2 • Similarly to move a function 2 units left we must replace the old x in the equation with x + 2.y = (x + 2)2 • And to move a function 2 units down we must replace the old y in the equation with y + 2.y + 2 = x2ory = x2 – 2
(-3,5) (1,3) (-2,4) (3,0) Make my graph y = -(x – 1)2 + 3 y = -2(x + 3)2 + 5 y = -(x + 2)2 + 4 y = 0.5(x – 3)2
Don’t tell students the rules! Help them discover the rules!
(-3,5) Write my equation This equation sets the vertex at (-3, 5) y = a(x + 3)2 + 5 Use the point (-2, 3) to determine the value of a 3 = a(-2 + 3)2 + 5 3 = a(1)2 + 5 y = –2(x + 3)2 + 5
Program:CBRSET • Prompt S,N • round (S/N, 5)I • If I > 0.2:-0.25 int(-4I) I • Send ({0}) • Send ({1, 11, 2, 0, 0, 0}) • Send({3, I, N, 1, 0, 0, 0, 0, 1, 1}) CBR will collect 40 data pairs in 6 seconds
Program:CBRGET • Send ({5,1}) • Get (L2) • Get (L1) • Plot 1 (Scatter, L1, L2, · ) • ZoomStat Program will transfer data from CBR, set window, and plot graph on your calculator
A single ball bounce • Set CBR to collect 20 data points during one second. • Drop a ball from a height of about 0.5 meters and trigger the CBR from about 0.5 meters above the ball. Transfer data to all calculators. • Model your parabola with an equation of the form y = a(x – h)2 + k Find a by trial & error or find a by substituting another choice of x and y.
Modeling provides students with • a logical reason for learning algebra- kids don’t ask“When am I ever going to use this?” • Students can gain important conceptual understandings and build up their “bank” of basic symbolic algebra skills. • an integration of algebra with geometry, statistics, data analysis, functions, probability, and trigonometry.
In General identifies the location of the vertex after a translation from (0, 0) to (h, k). This parabola shows a vertical scale factor, a, and horizontal scale factor, b.
Locate your vertex (h, k) • Then find your stretch factors (a & b) by selecting another data point (x1,y1). (h, k) = (0.86, 0.6)
A transformation of y = x2 Choose point (x1,y1) = (1.14, 0.18)
A transformation of y = x2 y = –5.36(x – 0.86)2 + 0.6
(0.9, 0.68) Another bounce example (h, k) = (0.9, 0.68) Choose (x1,y1)= (1.16,1.02)
A Case for Vertex Form • y = a(x – h)2 + k • Vertex is visible at (h, k) • Easy to approximate the value of a • Supports the order of operations • Easy to solve for x (by undoing)
Evaluate by emphasizing the order of operations • Evaluate this expression when x = 4.5 4.5 3 • Subtract 1.5 9 • Square - 45 • Multiply by –5 - 33 • Add 12 • So, the value of the expression at x = 4.5 is –33
3 9 –45 –33 An organization template Evaluate this expression when x = 4.5 Operations Results Pick x = 4.5 4.5 – (1.5) ( )2 x (–5) + (12)
4.5, -1.5 ± 3 9 -45 Solve equations by undoing Results Operations Undo Pick x x = – (1.5) + (1.5) ( )2 ± x (-5) ÷ (-5) + (12) – (12) -33
Verification! -33 = -5(x – 1.5)2 + 12 when x = -1.5 or 4.5
What question is asked? 5.03(x – 0.9)2 + 0.68 = 1 Operations Undo Result Pick x 1.15…, 0.647… x = – (0.9) + (0.9) ± 0.252… ( )2 ± 0.0636… 0.32 x (5.03) ÷ (5.03) + (0.68) – (0.68) 1
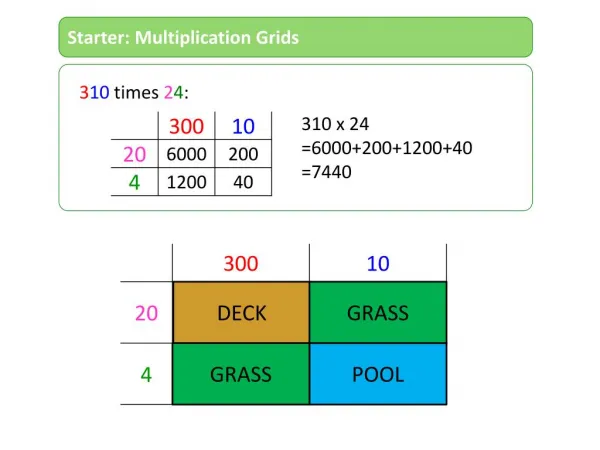
Polynomial Vertex Form • Use a rectangular model to help complete the square.
Polynomial Vertex Form • Use a rectangular model to help complete the square.
What question is asked? x2 + 12x + 13 = 0 Or (x + 6)2 – 23 = 0 Operations Undo Result Pick x ± (23) – 6 x = + (6) – (6) ± (23) ( )2 ± 23 0 – (23) + (23)
General Vertex Form • Use a rectangular model to help complete the square.
Vertex is General form and the vertex
Rolling Along • Place the CBR at the high end of the table. • Roll the can up from the low end. It should get no closer than 0.5 meters to the CBR. • Collect data for about 6 seconds.
y = √ (1 – x2)A good function to exhibit horizontal stretches
And if the vertex isn’t available? • How about finding a, b, and c by using 3 data pairs? y = ax2 + bx + c
“If we introduce symbolism before the concept is understood, we force students to memorize empty symbols and operations on those symbols rather than internalize the concept.” [Stephen Willoughby, Mathematics Teaching in the Middle School, February 1997, p. 218.]