Download
1 / 4

E N D
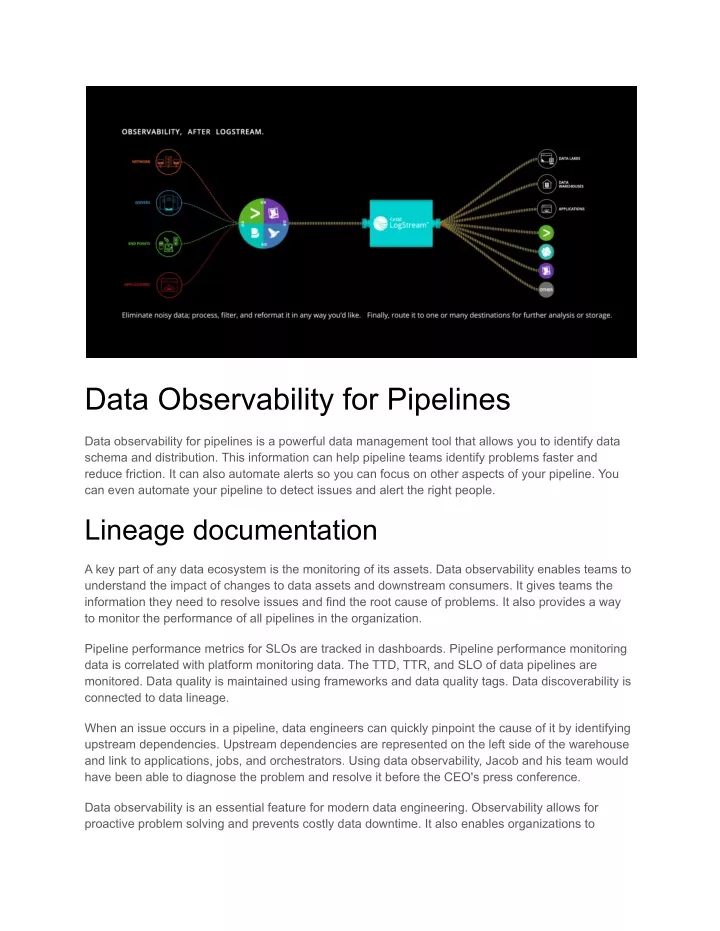
Data Observability for Pipelines Data observability for pipelines is a powerful data management tool that allows you to identify data schema and distribution. This information can help pipeline teams identify problems faster and reduce friction. It can also automate alerts so you can focus on other aspects of your pipeline. You can even automate your pipeline to detect issues and alert the right people. Lineage documentation A key part of any data ecosystem is the monitoring of its assets. Data observability enables teams to understand the impact of changes to data assets and downstream consumers. It gives teams the information they need to resolve issues and find the root cause of problems. It also provides a way to monitor the performance of all pipelines in the organization. Pipeline performance metrics for SLOs are tracked in dashboards. Pipeline performance monitoring data is correlated with platform monitoring data. The TTD, TTR, and SLO of data pipelines are monitored. Data quality is maintained using frameworks and data quality tags. Data discoverability is connected to data lineage. When an issue occurs in a pipeline, data engineers can quickly pinpoint the cause of it by identifying upstream dependencies. Upstream dependencies are represented on the left side of the warehouse and link to applications, jobs, and orchestrators. Using data observability, Jacob and his team would have been able to diagnose the problem and resolve it before the CEO's press conference. Data observability is an essential feature for modern data engineering. Observability allows for proactive problem solving and prevents costly data downtime. It also enables organizations to
ensure their data is secure and compliant. By enabling the pipeline to monitor data at rest, data teams can ensure it is being processed in the most efficient and cost-effective manner. Data pipelines should be transparent and have detailed job monitoring. Observability also helps engineers to identify problem areas and perform more targeted root-cause analysis. It also allows them to track and remediate any data-related flaws. Monitoring workflows The growing amount of data being processed by organizations today makes data observability a necessity. It can help organizations maintain their data pipelines, ensure that output is accurate, and perform focused root-cause analyses. In fact, Forrester estimates that 40% of data team time is consumed by data quality issues. Data observability can help data teams avoid these problems and focus on delivering quality output. By providing context on the status of data assets, data observability provides developers with insights that can be used to fix problems or prevent errors before they arise. This proactive data analysis improves efficiency and saves time. It also helps identify critical resources, dependencies, and invariants. It also provides context for root-cause analyses. Observability also helps limit data downtime. Data pipelines often experience problems in processing, including high levels of latency, low throughput, or incomplete output. By monitoring pipeline health and limiting data downtime, observability can help organizations avoid costly downtime. It also helps prevent data from being lost or corrupted. VISIT HERE The concept of observability has gained popularity over the past several years. It involves pairing monitoring tasks with additional context in order to provide teams with knowledge of when a problem is occurring and how to resolve it quickly. It enables faster detection, analysis, and resolution of problems, reducing the MTTA and MTTR of systems. Monitoring workflows with data observeability is critical for data engineers. It allows them to communicate progress to users and other team members, and it can improve the pipeline itself. By recording metadata, data engineers can automate alerts. Identifying anomalies Identifying anomalies in pipeline data is an important part of optimizing pipeline operations. It can provide actionable insights about a range of topics. Examples include security breaches, roaming abuse, out-of-pattern medical spends, and more. Identifying anomalies can help improve operational efficiency, improve product quality, and reduce costs. Pipelines can become stalled if they deliver bad data. These bad datasets may not even be detectable by downstream consumers, but they can infect the entire pipeline's business processes.
Using an anomaly detection dashboard is one way to meet pipeline SLAs and avoid unnecessary downtime. Pipeline data is often stored in multiple systems, making it difficult to integrate them into a single, central data store. Fortunately, there are a number of ways to leverage pipeline data in your data warehouse. For example, you can use a database to collect and store data, and then analyze the data using machine learning. With an accurate system, you can detect anomalies and make informed decisions about your pipeline operations. Identifying anomalies in pipeline data is a complex process that involves numerous factors. The process of identifying these outliers can help uncover new knowledge in data. It is a crucial step for many applications, but is especially important in real-time applications. This chapter explains the challenges involved, the best tools, and how to use these techniques. Traditionally, anomaly detection relied on rules and batch processing. But this approach is not scalable as data becomes more complex. A better, more efficient approach uses algorithms that identify anomalies before events occur. In addition to this, you can train models to look back in time and make predictions. To get the best results, you should use a platform that enables you to monitor your pipeline data in real-time. Improving data quality Improving data quality for your pipeline is essential for a variety of reasons. First, raw data must undergo validation checks before it can be made available for use by all downstream users. Next, you must make sure that your data is as consistent as possible. To achieve this, you can start by defining the quality of data that you expect from the pipeline. This will help you decide which operations should be performed on incoming data. These operations may include replacing null values with standard terms, transforming data values, or parsing data into two or more columns. Improving data quality is important for organizations of all sizes. Without it, they could face costly errors. Gartner estimates that inaccurate or incomplete data costs organizations $15 million every year. Luckily, there are ways to tackle data quality problems and avoid them entirely. Listed below are some steps to improve data quality in your pipeline. Improving data quality is an ongoing process. Organizations source data from different sources, which means that they must constantly update their data quality guidelines to ensure consistency and accuracy. Data quality can be improved by reducing duplicate data and using reliable, consistent data. You can also automate and integrate data streams. Lastly, you can remove corrupt entries from your data stream. Whether you are using a traditional data warehouse or a data lake, ensuring data quality is crucial. Data scientists and engineers spend up to 40 percent of their time on data quality issues. This is why it's important to invest in data quality tools. They can either be built into your data warehouse or purchased separately.
Tools available to monitor pipelines Monitoring pipeline data is an important process that enables you to identify performance issues and implement better frameworks for data transfer. It is a process that involves tracking data from the source to the repository and provides valuable insights into the pipeline. Monitoring can ensure that data transfer occurs smoothly and efficiently. Listed below are a few tools that can help you monitor pipeline data. Monitoring tools track the quality and consistency of pipeline data. These tools can also flag and prioritize problems. They can also offer deep insights into data, enabling you to make better decisions and improve performance. Using these tools to monitor pipeline data is a crucial step towards improving data quality. If done properly, pipeline monitoring tools can also help you improve data ingestion. There are many data pipeline tools available, and the best one for you depends on whether you're working with batch data or real-time data. Batch data is processed in bulk, while real-time data is processed on a continuous basis. When choosing a tool, it's important to find one that can handle both types of data, so that you can get the best value for your money. Data pipelines typically involve a variety of tools, including Spark, Airflow, and Kubernetes. Each one has many different components, making it difficult to monitor the entire pipeline. This diversity of tools makes it impossible for anyone to gain a true understanding of the pipeline's performance without a tool. Tools available to monitor pipeline data should be fine-tuned to monitor the components of the pipeline and identify problems in a timely manner. These tools should monitor data quality problems, pipeline dependencies, and schedule glitches.