Download
1 / 67
670 likes | 671 Views
This study presents empirical ionospheric models generated from long-term data collected by worldwide incoherent scatter radars. The models provide insights into the variations of key ionospheric parameters and their applications in space weather research. Available data and future projects are also discussed.

E N D
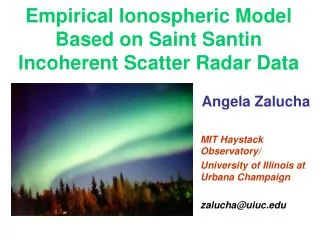
Empirical Ionospheric Models from Worldwide Incoherent Scatter Radars Shun-Rong Zhang and John Holt MIT Haystack Observatory, USA Tony van Eyken EISCAT Association, Norway Mary McCready SRI International, USA Christine Amory-Mazaudier Centre for the Study of Earth and Planets Environments, CNRS, France Shoichiro Fukao Research Institute for Sustainable Humanosphere, Kyoto University, Japan Michael Sulzer Arecibo Observatory, National Astronomy & Ionosphere Center, Puerto Rico
Outline • ISR long-term database • Modeling technique • Results: local models • A case study: Annual variations • Comparisons with IRI • Applications • Regional Models • ISR Convection Model • Model Availability • Future Projects
MADRIGAL: Long-term ISR Database www.openmadrigal.org
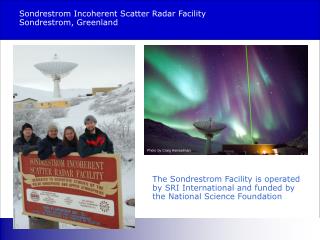
Existing Long-term Data • The European Chain: • EISCAT Svalbard Radar (1997-), in polar cap, the highest latitude • EISCAT Tromsø UHF radar (1984-) and VHF radar (1990-), • St. Santin Radar (1973-1986) • East America Chain • Sondrestrom Radar (1990-) • Millstone Hill Radar (1970-) • Arecibo Radar (1966-) • East Asia • MU Radar (1986-2003)
Binning and Fitting technique • Data are binned according to local time and month • Piece-wise linear height profile is used for initial data binning with 17-19 height nodes. • Solar activity dependency is determined by a leaset-squares fit to a linear function to F107. • Median filter (3 months x 3 hours) is applied to the fitting coefficients.
Analytic representations of bin-fit results • Seasonal variations: harmonics with 12, 6 and 3 month components • Local time variations: harmonics with 24, 12, 6 and 3 hour components • Height variations: cubic B-spline with 17 breaks and gradient controls at upper and lower boundaries.
Results:Midday Ne Svalbard Sondrestrom Curve Color Code Winter Spring Summer Autumn Tromso Millstone St. Santin Shigariki Arecibo
Results:Latitudinal and Longitudinal features Semiannual components starts to occur highlatitude Semiannual components, longitudinal differences subauroral midlatitude Lower midlatitude Strong semiannual components, asymmetry
O/N2 and SZA change SZA = solar zenith angle O/N2 (from MSIS) O/N2 x cos (SZA)
Ti At Millstone, highest Ti occurs in May.
Yearly variations in midday Ti at 350 km: Millstone Circles: Data Dashed: Model Data - Model difference Percentage difference F107
Comparisons with IRI: diurnal Median solar activity conditions with F107=135 or Rz=88 Ne Ne Ne Ne Ne Ne Ne Ti Ti Ti Ti Ti Ti Ti Te Te Te Te Te Te Te
Comparisons with IRI: profile Median solar activity conditions with F107=135 or Rz=88 Ne Ne Ne Ne Ne Ne Ne Ti Ti Ti Ti Ti Ti Ti Te Te Te Te Te Te Te
Model Applications: Tn and [O] Using a simplified energy equations for ions (widely used in the ISR community for the neutral parameter deduction)
Regional Ionospheric Models:Millstone Areas Millstone Regional Ionospheric Model covers geodetic latitudes 35-55 degrees.
ISR Convection Model: data A Combined Dataset from Millstone and Sondrestrom ISRs Observations
ISR Model Availability • Virtual Incoherent Scatter Radars • Web interface • FTP http://madrigal.haystack.mit.edu/models OR http://www.openmadrigal.org
Future Projects • Regional ionospheric models for • Eastern America longitudes • European longitudes
A New Space Weather Project • Multiple incoherent scatter radar long-term database study of upper atmosphere climatology and variability • to generate databases of thermospheric Tn, [O], winds for multiple ISRs; • to develop local and regional models of the thermospheric parameters; • to create variability models of the ionospheric as well as thermospheric parameters; • to study latitudinal/longitudinal features of the ionosphere and thermosphere.