Download
1 / 43
430 likes | 543 Views
Linking policies through land use scenarios to ecosystem services loss. Ana Paula Dutra de Aguiar Eloi Lennon Dalla Nora. São José dos Campos, April of 2014. Topics. Introduction : Modeling approaches International x regional factors Results

E N D
Linking policies through land use scenarios to ecosystem services loss Ana Paula Dutra de Aguiar Eloi Lennon Dalla Nora São José dos Campos, April of 2014
Topics • Introduction: • Modeling approaches • International x regional factors • Results • Eloi’sBRAmazon+BRCerradoresults (Scenarios GAM, RAM, GAM+BT, RAM+BT) • AMAZALERT BRAmazonresults– Scenario A, B and C (2100)
General structure of LUC models • Despite the diversity of land use models found in the literature it is possible to identify a common functional structure that is valid for most of the available cases; • Dalla-Nora et al., (no prelo)
LUC MODELS FOR THE AMAZON 2020 2020 2050 Aguiar et al., 2006 Lauranceet al., 2001 Lapolaet al., 2011 2050 2030 Soares-Filho et al., 2006 Nepstadet al., 2008
Quantity of change in LUC models • None of the previous studies were able to plausibly capture the general trajectory of land cover change observed in this region during the last decade; • Dalla-Nora et al., (no prelo)
Quantity of change in LUC models • Modeling approaches: • Global approach • Intra-regional approach • Dalla-Nora et al., (no prelo)
Model results and Amazon LUC dynamics • Models structure requires a clear differentiation between the spatial and underlying drivers of change; • Machado, 2002 • Laurance e al., 2001 • Laurance e al., 2001
Model results and Amazon LUC dynamics • If Amazon deforestation was a result of price movements, we would expect that the slowdown in deforestation would be conjunctural and temporary; • Dalla-Nora et al., (no prelo)
Model results and Amazon LUC dynamics • Protected areas (PAs) • 240 new PAs from 2004 • +65% over 2000-2004 • 55% of the remaining forests. • Credit access • All lines of rural credit • -65% (all rural municipalities) • -77% (MT, PA, RO) • Command and control • Monitoring and enforcement • +8.823 fines • 70 times more over 2000-2004 • Dalla-Nora et al., (no prelo)
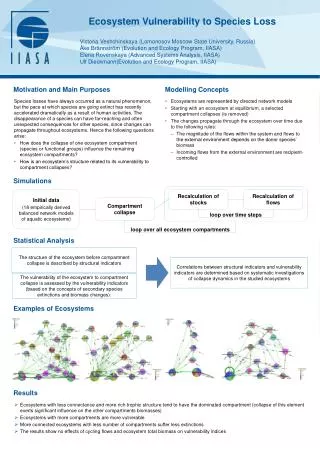
Model results and Amazon LUC dynamics • Previous modeling studies were not able to integrate the global and regional forces that shape land use dynamics in the Amazon; • Scenarios' formulation was also quite simplistic which compromised their ability to explore contrasting pathways; • It's necessary to adopt an innovative modeling framework to represent land use systems as open systems;
EloiDalla Nora’s thesis • The central idea is to represent land systems as open systems; • Global scale • Regional scale • Direct LUC drivers • Underlying LUC drivers • Intra-regional dynamics Lucc-ME • Dalla-Nora et al., (submitted)
Land demand • National land demand is split over AEZs, as defined in the GTAP-8 LUC-Database, the GeoDB consistent with the Economic GTAP-8 DB used in MAGNET; Spatial distribution of the global AEZs and Brazil’s biome-driven AEZs aggregation • Dalla-Nora et al., (submitted)
Land allocation • Land demand projections are allocated based on spatially explicit LUC models built on top of the LuccME Framework; • Aguiar et al., (2012)
Scenarios • A global baseline scenario (based on USDA (2012) and IPCC (2013) GDP and population projections) was run testing different regimes of land use regulation up to 2050; Population Growth GDP Growth Brazil World World Brazil 33% 19% 183% 185% Production Growth World Brazil 109% 110% • Dalla-Nora et al., (submitted)
Land demand • Such strategy allowed to simulate key land use policies for the Amazon; • Dalla-Nora et al., (submitted)
Scenarios • Dalla-Nora et al., (submitted)
Paved Roads - Log10(Minimum distance to the nearest Federal or State road) 2050 ACCESSIBILITY – SCENARIO RAM (AMAZALERT C 2010 2015 2025 2030 2042 2010 Unpaved Roads - Log10(Minimum distance to the nearest unpaved Federal or State road) Very close Very distant Connection to National Markets (index representing the degree of connectivity to SP and NE through the roads network) Very close Very distant High Low
2050 2050 2010 2010 PROTECTED AREAS - SCENARIOS A and B 2010 PROTECTED AREAS - SCENARIO C 2022 2010 2018 2020
Land allocation • Land demand projections could also lead to contrasting land cover change patters; • RAM • GAM
Land allocation • Biofuel targets could strength the deforestation patters observed under the GAM and RAM scenarios; • RAM+BT • GAM+BT
MAGNET global model Amountofchange LUCCME Demand (scenarios) Stakeholder inputs SpatialPatterns LUCCME Potential/Allocation (scenarios) Visions – Stakeholder inputs Biophisical, socioeconomicandinstitutionalfactorsaffectthe DemandandAllocation
MAGNET global model Amountofchange Global: population, GDP andproductiongrowth + biofuelstargets Regional: roads, protectedareas, credit LUCCME Demand (scenarios) Stakeholder Storylinesandcontrasting rates ofchange SpatialPatterns LUCCME Potential/Allocation (scenarios) Visions – Stakeholder inputs Regional: roads, protectedareas, lawenforcement Biophisical, socioeconomicandinstitutionalfactorsaffectthe DemandandAllocation
Presente Futuro e Trajetória em torno de quatro temas: II - Desenvolvimento social IV - Contexto institucional III - Atividades econômicas I - Recursos naturais AMAZALERT DESENVOLVIMENTO AMBIENTAL 1ª e 2a OFICINA de STAKEHOLDERS ALTO CENÁRIO A: SUSTENTABILIDADE CENÁRIO B: MEIO DO CAMINHO DESENVOLVIMENTO SOCIOECONOMICO BAIXO ALTO CENÁRIO C: FRAGMENTAÇÃO E CAOS BAIXO
STAKEHOLDER WORKSHOPS IN BRAZIL ETAPA 1 (Belém): primeira definição dos cenários ETAPA 2 (Brasília): refinamento das trajetórias Presente, Futuro e Trajetória em torno de quatro temas: II - Desenvolvimento social IV - Contexto institucional III - Atividades econômicas I - Recursos naturais ETAPA 1: organizações da sociedade civil e setor produtivo ETAPA 2: organizações da sociedade civil, setor produtivo, governo e pesquisadores
International policies (WP4 report) • International policies and initiatives • UNFCCC forest management and harvested wood products accounting • Nationally appropriate mitigation actions (NAMAs) • Reducing emissions from deforestation and forest degradation (REDD) • REDD under the voluntary carbon market • Standards and certification • National and regional policies and initiatives outside of Amazonian nations • EU renewableenergydirective (EU RED) • Mandatory national renewable energy targets • Sustainability criteria for biofuels • Sustainability Criteria for biomass for heat and power • U.S. programs • U.S. Renewable Fuel Standard 2 (RFS2) • U.S. Stationary sources, proposed approach • California Low Carbon Fuel Standard • Chinese policies and trade • Biofuel targets in China • The current and future soybean trade between China and Brazil
Brazilian public policies affecting the Amazon (WP4 report) FOREST CODE CREDIT AND SUBSIDIES PROGRAMS SOY MORATORIUM POLICY FOR LAND TITLING LAND ZONING FOOD PURCHASE PROGRAM PAYMENT FOR ENVIRONMENTAL SERVICES INFRASTRUCTURE FOR TRANSPORTATION AND ENERGY CLIMATE CHANGE PLANS, INCLUDING REDD+ IN EACH AMAZONIAN STATE Program for the Acceleration of Development PAC Action Plan for Prevention and Control of the Legal Amazon Deforestation (PPCDAM)
For comparison RCP (~10 000km2) Prepared by EloiDalla Nora
Premises • Scenario C • 19500 km2yr-1 (until 2100) • (ave 1996-2005) • Scenario B: • 3900 km2 in 2020 • (20% 19500 km2) • Scenario A: • “Zero” • Deforestation • Scenario D? 10000km2
(A) Scenario A: Deforestation in 2050 (B) Scenario B: Deforestation in 2050 (C) Scenario C: Deforestation in 2050 (D) Scenario A: Secondary Vegetation in 2050 (E) Scenario B: Secondary Vegetation in 2050 (F) Scenario C: Secondary Vegetation in 2050 (G) Scenario A: Agriculture in 2050 (H) Scenario B: Agriculture in 2050 (I) Scenario C: Agriculture in 2050
Scenario C v28 – May 2014 BRAmazon, BRBoliviaand ROBIN
2100 (oldgrowthorprimary) Forest cover - 2050
(oldgrowthorprimary) Forest cover - 2100 BrazilianAmazon: 60% deforested (fragemented in mostcells, 20% remaining)
Summary • Wecancreatestorylines for Scenario C (RAM /RAM –GT) andScenario A (GAM) • Usiningthestakeholder meetings • mentioningthe policies W4 reported • Resulting in thespatialscenarios • Ecosystem Services: derivedindicators