Download
1 / 36
390 likes | 448 Views
بسم الله الرحمن الرحيم. Chapter 3: Data and Signals. Faculty of Computing and Information Technology, KAU Computer Science Department. Chapter 3: Data and Signals. 3.1 ANALOG and DIGITAL 3.2 PERIODIC ANALOG SIGNALS 3.3 DIGITAL SIGNALS 3.4 TRANSMISSION IMPAIRMENT. Signals.

E N D
بسم الله الرحمن الرحيم Chapter 3: Data and Signals Faculty of Computing and Information Technology, KAU Computer Science Department
Chapter 3:Data and Signals 3.1ANALOG and DIGITAL 3.2PERIODIC ANALOG SIGNALS 3.3DIGITAL SIGNALS 3.4TRANSMISSION IMPAIRMENT
Signals • Transmission of data across network connections: • Collection numerical statistics from another computer • Sending animated pictures from a design workstation • Causing a bell to ring at distant control center • Data usable to a person or computer are not in the form for transmission over a network • Photograph can not be transmitted as it is • Encoded description of the photograph (1s and 0s) that tells the receiving device how to reconstruct the image of photograph can be transmitted • Data stream of 1s and 0s must be turned into energy in the form of electromagnetic signals
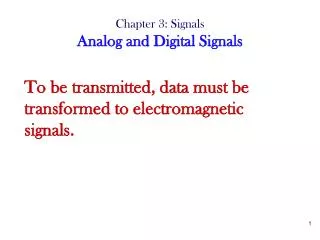
Note Signals To be transmitted, data must be transformed to electromagnetic signals.
3.1 ANALOG AND DIGITAL • Data can be analog or digital. • The term analog data refers to information that is continuous; • An analog clock has hour, minute and second hands: • The movements of the hands are continuous. • Human voice • Digital data refers to information that has discrete states. • Data stored in the memory of a computer • A digital clock: • Hours and minutes will change suddenly from 8:05 to 8:06. • Analog signals can have an infinite number of values in a range; • Digital signals can have only a limited number of values as simple as 1 and 0 • Conclusion: • Analog data take on continuous values. • Digital data take on discrete values. • Can be modulated into an analog signal for transmission across a medium.
Periodic and Aperiodic Signals • Analog and digital signals can be in the form periodic and nonperiodic (aperiodic) • Periodic signal • Completes a pattern within a measurable time frame called period • Repeats that pattern over subsequent identical periods • Completion of one full pattern is called a cycle • Aperiodic signal changes without exhibiting a pattern or cycle that repeats over time • In data communications, we commonly use • periodic analog signals (because they need less bandwidth) • Nonperiodic digital signals because they can represent variation in data.
3.2 Periodic Analog Signals Periodic analog signals can be classified as • simple • or composite. A simple periodic analog signal, a sine wave, cannot be decomposed into simpler signals. A composite periodic analog signal is composed of multiple sine waves
A sine Wave • It is the fundamental form of a periodic analog signal. • A sine wave can be represented by three parameters: • The peak amplitude • The frequency • The phase
Peak Amplitude • It is the absolute value of its highest intensity, proportional to the energy it carries. • For electric signals, peak amplitude is measured in volts. Two signals with the same phase and frequency, but different amplitudes
Peak Amplitude Example: • The power in your house can be represented by a sine wave with a peak amplitude of 155 to 170 V. • However, it is common knowledge that the voltage of the power in U.S. homes is 110 to 120 V. • This discrepancy is due to the fact that these are root mean square (rms) values. • The signal is squared and then the average amplitude is calculated. The peak value is equal to • 2½ × rms value. • The voltage of a battery is a constant; this constant value can be considered a sine wave, as we will see later. • For example, the peak value of an AA battery is normally 1.5 V.
Period and Frequency • Period refers to • the amount of time, in seconds, a signal needs to complete 1 cycle. • Frequency refers to • the number of periods in 1 s. Frequency and period are the inverse of each other.
Two signals with the same amplitude and phase, but different frequencies
Period and Frequency • Period is measured in seconds. • Frequency is expressed Hertz (Hz), which is cycle per second.
Period and Frequency • Example: • The power we use at home has a frequency of 60 Hz. The period of this sine wave can be determined as follows:
Period and Frequency • Example: • Express a period of 100 ms in microseconds. • Solution • From Table 3.1 • We find the equivalents of • 1 ms is is 10−3 s • 1 s is 106 μs. • We make the following substitutions:.
Period and Frequency • Example: • The period of a signal is 100 ms. What is its frequency in kilohertz? • Solution • First we change 100 ms to seconds, and then we calculate the frequency from the period (1 Hz = 10−3 kHz).
More about frequency • Frequency is the rate of change with respect to time. • Change in a short span of time means high frequency. • Change over a long span of time means low frequency. • If a signal does not change at all, its frequency is zero. • If a signal changes instantaneously, its frequency is infinite.
Phase • Phase: the position of the waveform relative to time 0 • If wave can be shifted backward or forward along the time axis phase describes the amount of that shift. It indicates the status of the first cycle • Measured in degrees or radians • 360 = 2 rad • 1 = 2/360 rad • 1 rad = 360/(2)
Phase Phase Phase Three sine waves with the same amplitude and frequency, but different phases
3.3 Digital Signals • In addition to analog signal, information can also be represented by a digital signal • For example: 1 can be encoded as a positive voltage, 0 as zero voltage. 1 bit per level
3.3 Digital Signals • A digital signal can have more than 2 levels. In this case, we can send more than 1 bit for each level. 2 bits per level
3.3 Digital Signals • In general, if a signal has L levels, each level needs: log2 L bits • Example: A digital signal has 8 levels. How many bits are needed per level? • We calculate the number of bits from the formula: • Each signal level is represented by 3 bits.
3.3 Digital Signals • Example: A digital signal has 9 levels. How many bits are needed per level? • The number of bits sent per level needs to be an integer as well as a power of 2. For this example, 4 bits can represent one level. 9 3.17
3.3 Digital Signals Bit Rate: • The number of bits sent in 1second • Expressed in: bits per second (bps) 8 bits sent in 1 s, Bit rate = 8 bps 16 bits sent in 1 s, Bit rate = 16 bps
3.3 Digital Signals • Example: Assume we need to download text documents at the rate of 100 pages per second. What is the required bit rate of the channel? • Solution • A page is an average of 24 lines with 80 characters in each line. If we assume that one character requires 8 bits, the bit rate is: 1.536 Mbps
3.3 Digital Signals • Bit Length: the distance one bit occupies on the transmission medium Bit length = propagation speed bit duration
3.4 TRANSMISSON IMPAIRMENT Signals travel through transmission media, which are not perfect. The imperfection causes signal impairment. This means that the signal at the beginning of the medium is not the same as the signal at the end of the medium. What is sent is not what is received. Three causes of impairment are attenuation, distortion, and noise. Topics discussed in this section: Attenuation Distortion Noise
Attenuation • Means a loss of energy • When a signal, simple or composite, travels through a medium ,it loses some of its energy in overcoming the resistance of the medium. • Wire gets Warm or hot because some of the electrical energy in the signal is converted to heat. • Amplifiers are used to amplify the signal • Figure 3.26 shows the effect of attenuation and amplification
Decibel • Engineers use the unit of the decibel, to show that a signal has lost or gained strength. • The decibel (dB) measures the relative strengths of two signals or one signal at two different points. • Decibel is • negative if a signal is attenuated • positive if a signal is amplified • dB = 10log10P2/P1
Distortion • Means that signal changes its form or shape. • Distortion can occur in a composite signal made of different frequencies. • Each signal component has its own propagation speed through a medium, and therefore, its own delay in arriving at the final destination. • Differences in delay may create a difference in phase if the delay is not exactly the same as the period duration.
Noise • Noise is another cause of impairment. • Several types of noise: • Thermal noise • Induced noise • Crosstalk noise • Impulse noise • These type of noise may corrupt the signal. • Thermal noise is the random motion of electrons in a wire which creates an extra signal not originally sent by the transmitter. • Induced noise comes from sources such as motors and appliances. • These devices act as a sending antenna, and the transmission medium acts as the receiving antenna. • Crosstalk is the effect of one wire on the other. One wire acts as a sending antenna and the other as the other as the receiving antenna. • Impulse noise is a spike (a signal with high energy in a very short time) that comes from power lines, lightning, and so on