Download
1 / 21
220 likes | 360 Views
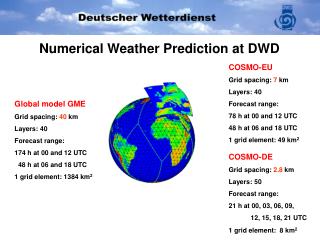
The use of observations in global Numerical Weather Prediction. Florence Rabier ECMWF Carla Cardinali , Stephen English, Marta Janiskova ECMWF Nathalie Boullot , Philippe Chambon , Nadia Fourrie , Fatima Karbou , Jean-Francois Mahfouf Meteo -France and CNRS Rolf Langland, NRL

E N D
The use of observations in global NumericalWeather Prediction Florence Rabier ECMWF Carla Cardinali, Stephen English, Marta Janiskova ECMWF Nathalie Boullot, Philippe Chambon, Nadia Fourrie, Fatima Karbou, Jean-Francois Mahfouf Meteo-France and CNRS Rolf Langland, NRL Ron Gelaro, GMAO Thomas August, Tim Hultberg EUMETSAT
Observation numbers Advanced microwave sounders, Hyperspectral data, GPS Radio-Occultation…
Sensitivity of an analysisxato an observing system yo(capacity to change the atmospheric state) WhereHis the observation operator and Kis the Kalman gain Degrees of Freedom for Signal • Under linearassumption
Current usage of observations Meteo-France ECMWF AIRS DFS AMSU-A CY38T1 GPS-RO IASI Aircrafts Temp Meteo-France ECMWF Observation Number
xbf deltaJ xaf time t-1 t0 t1 J Forecastsensitivity to observations (FSO) • Evaluation of the capacity of the various observing systems to reduce short-range forecast errors (defined by a function J) • J : 3D integrated dry total energy of the differencebetween the 24h forecast and a reference state • Forecasterrorreduction using the adjoint technique :
FSO - ForecastErrorReduction Number of observations per type Meteo-France Forecasterror Reduction in percentage ECMWF
Large uncertainty South of 45 S In particular, 45-70S To the north: Geostationary satellite winds, ship surface obs, commercial aircraft routes To the south: Antarctic raobs and land surface data, MODIS and AVHRR winds Current satellite radiance observations are not sufficient to achieve low analysis errors
Impact of observations (Southern pole) AMV AMSU-A IASI SSMIS RAOB AMSU-A GPS-RO RAOB IASI AIRS AMSU-A IASI AMSU-B Surface RAOB AMSU-A AIRS IASI GPS-RO Surface
Sea-Icelimit 640 Dropsondes
Additionalchannels, future: principal components Previous configuration Revised configuration Additional IASI WV channels at Meteo-France large improvement in humidity scores • 21 channels 9 channels
Use of data over land/sea-iceVariability of microwaveemissivity • For AMSU-A, 50GHz emissivityused for 52-55 GHz obs • For AMSU-B, a parametrisation of 150 GHz emissivityfrom 89 and 150 GHz information used for 183GHz obs • Improvement in forecast scores at Meteo-France EUMETSAT OSI SAF January 2009
Average inversion strength (layer 850-1000 hPa) Experimentusing AMSU over sea-ice • Difference in inversion strengthbrought by a largerwarming at 850hPa than at 1000 hPa Control
New technologies in space Cloud radar and lidar Radar Lidar O B A 2000 km
Use of research satellites Megha-Tropiques: Indo-French mission (ISRO & CNES) Altitude: 875 kilometers inclination: 20° within the Tropical belt (3 to 5 times a day) SAPHIR instrument: Microwave instrument with 6 channels around 183 GHz 10 km resolution at nadir (183.1 +/-1.1 GHz on 07/02/2012 at UTC 0h)
Impact of SAPHIR data on forecasts Meteo-France 100 200 300 400 500 ≈10% ≈7% Pressure levels (hPa) 700 850 925 1000 ≈1 to 3% of RMS relative improvement Scores computed over a 2-month period in summer 2012 RMS difference between the CTRL run and the SAPHIR assimilation experiment, Over the Tropics, for Relative Humidity
Concludingremarks • Number and variety of observations have been increasing tremendously • Evaluating data impact: Observing System Experiments, • information content, reduction in forecast error • Use and impact of observations: an example over the Southern polar area • Developments enhancing the usefulness of observations: • research satellites • satellite data over land/sea-ice • cloud information • data compression (principal components for hyperspectral) • GPS- ZTD • radiosonde with exact positioning…