Download
1 / 37
370 likes | 379 Views
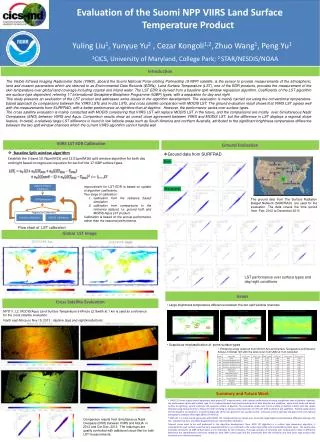
Assimilating Retrievals of Sea Surface Temperature from VIIRS and AMSR2. Bruce Brasnett and Dorina Surcel Colan CMDE November 21, 2014. Brasnett, B. and D. Surcel Colan, 2014: Assimilating Retrievals of Sea Surface Temperature from VIIRS and AMSR2, Submitted to J. Atmos. Oceanic Technol.

E N D
Assimilating Retrievals of Sea Surface Temperature from VIIRS and AMSR2 Bruce Brasnett and Dorina Surcel Colan CMDE November 21, 2014 Brasnett, B. and D. Surcel Colan, 2014: Assimilating Retrievals of Sea Surface Temperature from VIIRS and AMSR2, Submitted to J. Atmos. Oceanic Technol.
Contents • Introduction • AMSR2 SST Product • VIIRS SST Product • Assimilation Methodology • Evaluation of Contributions from AMSR2 and VIIRS • Conclusions
Introduction • SST analysis is used daily by many analysis and forecast systems, such as GDPS, RDPS and GIOPS • CMC operational program produces a daily global 0.2° analysis using in situ and satellite data, an updated version of the 1/3 °analysis described by Brasnett (2008) • The operational SST analysis assimilates retrievals from three AVHRR instruments, in situ observations, and ice data • SST analysis refers to a depth temperature (foundation SST) without diurnal variability
AMSR2 SST Product • AMSR2 – Advanced Microwave Scanning Radiometer 2 • Launched on May 18, 2012 aboard the Global Change Observing Mission – Water (GCOM-W1) satellite • Follow-on to AMSR-E (AQUA satellite – stopped in Oct. 2011) • Microwave remote sensing produces accurate SST data in clear and cloudy conditions • The AMSR2 retrievals used by this new analysis are produced by Remote Sensing System (RSS) • Retrievals are gridded by RSS onto 0.25°x 0.25°grid, separately for northbound and southbound orbits
AMSR2 SST Product • The AMSR2 instrument has a 2 m antenna (1.6 m for AMSR-E) giving a footprint of ~49 km ( 56 km for AMSR-E) • The swath width is 1450 km • Retrievals are generated in both clear and cloudy conditions • Limitations: retrievals are not possible through precipitating clouds or within ~75 km of land
AMSR2 SST Product SST retrievals for August 1st, 2014 from AMSR2
AMSR2 SST Product To eliminate the observations affected by diurnal variability: • RSS includes retrievals of surface wind speed • Daytime retrievals of SST are not used if the wind speed is less than 6 m/s between 25S and 25N • Elsewhere, daytime retrievals of SST are not used if the wind speed is less than 6 m/s within 45 days of the summer solstice
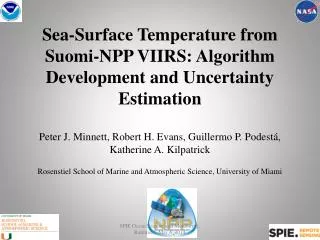
VIIRS SST Product • VIIRS – Visible Infrared Imaging Radiometer Suite • Launched on October 28, 2011 aboard Suomi National Polar-Orbiting Partnership (S-NPP) satellite • VIIRS instrument – significant advancement from AVHRR and MODIS (Miller et al. 2013) • VIIRS resolution: 740 m at nadir and 1.6 km at the edge of the scan • AVHRR resolution: 1.1 km at nadir and 6.7 km at the edge of the scan • Swath width 3000 km (as AVHRR) • Retrievals are not possible through cloud
VIIRS SST Product VIIRS (NPP)
VIIRS SST Product AVHRR (NOAA19)
VIIRS SST Product • VIIRS dataset produced by NOAA/NESDIS using Advanced Clear-Sky Processor for Oceans - ACSPO (Petrenko et al. 2014) • Better coverage than AVHRR • Better coverage in high latitudes • Data publicly available since May 2014, include quality flags and surface wind speeds • As for AMSR2, daytime retrievals are eliminated when the wind speed is less than 6 m/s between 25S and 25N and elsewhere within 45 days of the summer solstice
Assimilation Methodology • The statistical interpolation method described in Brasnett (2008) is applied to the analysis, the observation quality control, and to the satellite bias correction • Increased resolution at 0.1° • Background error correlations length scale reduced for high latitudes
Assimilation Methodology Length scales of the background error correlations 43 km 24 km
Assimilation Methodology • The statistical interpolation method described in Brasnett (2008) is applied to the analysis problem, the observation quality control, and to the satellite bias correction • Increased resolution at 0.1° • Background error correlations length scale reduced for high latitudes • Statistical Interpolation method used does not take account of correlated observations errors so satellite data are thinned • Observations spacing reduced compared to the operational SST analysis 0.2° (33 km compared to 44 km for infrared data at high latitudes)
Insertion of Ice Information • Proxy SST data are inserted at locations where ice is present • If the ice concentration is 0.6 or larger, then SST is set to -1.8°C (freezing point of sea water with a salinity of 33 psu) • If the ice concentration is between 0.6 and 0.9 and the time average of surface air temperature is greater than 0°C, then SST is set to 0°C • The proxy SSTs are assimilated with an ascribed observation error of 1°C
Insertion of Ice Information Locations of ice proxy data on August 19th 2014 0°C -1.8°C
Insertion of Ice Information • Better definition of the SST gradient near the ice edge SST gradient (K/100km) for August 1st 2014 0.1° 0.2°
Capturing Sudden SST Changes • SST changes of 3 K or more in one day occurs during the passage of intense tropical storms • The analysis quality control rejects good quality observations • During the quality control, the background error is amplified where the wind speed (from GDPS) is 21m/s or more • The unaltered background error is used to compute the analysis
Capturing Sudden SST Changes SST difference between the new analysis and the operational analysis for 9 July 2014, typhoon Neoguri
Other Changes • Different methods of processing the retrievals: • Infrared data – bi-linear interpolation of the background to the observation locations • Microwave data – averages the background values at grid-points within the footprint of AMSR2 • Pre-processing of closely spaced ship observations • Instead of “super observations” (average of two or more collocated observations), one report is chosen from the cluster (median SST), and the others are discarded
Evaluation 1) Three analyses produced with the same methodology on a 0.2° assimilating: a) AVHRR retrievals, b) AMSR2 retrievals and c) VIIRS retrievals • Verifications against independent measures – Argo floats • Independent observations used only if they are between 3 m and 5 m and within four standard deviations of the climatology • An average 144 observations per day were available for evaluation
Evaluation • Analysis with VIIRS consistently outperforms the analysis with AVHRR • VIIRS experiment better than AMSR2 experiment during January, February, March, May and September • AMSR2 experiment better than VIIRS during June, July and August • During the months when AMSR2 experiment was better, AMSR2 data was available 60% of the time compared to 30% of the time for VIIRS over some regions of the globe
VIIRS AMSR2 J, F, M J, J, A
Evaluation 2) Comparison between the operational 0.2°analysis, the new 0.1°analysis, and the GMPE (GHRSST Multi-Product Ensemble) product (Martin at al. 2012)
Evaluation The 0.1°analysis performs better than the operational analysis and than GMPE product even in April when no VIIRS data were available
Evaluation Are the improvements due to changes in the analysis methodology or to the addition of AMSR2 and VIIRS datasets?
Evaluation 3) Comparison between the operational 0.2° analysis, the operational analysis assimilating VIIRS and AMSR2 datasets and the new 0.1°analysis
Evaluation Most of the reduction in analysis standard deviation results from the addition of AMSR2 and VIIRS data
Evaluation • The new 0.1°analysis (left) assimilates many VIIRS retrievals but only AVHRR data (with poor coverage) are available for the operational analysis (right) Great Slave Lake, August 15, 2014
Conclusions • The new 0.1°analysis shows more skill than the operational analysis and than GMPE product • Most of the improvement is due to the addition of the AMSR2 and VIIRS datasets • Persistent cloudiness affects VIIRS analysis during the summer, but in clear sky the higher resolution VIIRS retrievals are more valuable than AMSR2 • Improved analysis of SST can have a positive influence on the global and regional atmospheric and oceanic systems, providing better fluxes at the ocean and lake surfaces
Merci beaucoup pour votre attention! Questions?
Definitions of SST Hypothetical vertical profiles of temperature for the upper 10m of the ocean surface in high wind speed conditions or during the night (red) and for low wind speed during the day (black).
http://iweb.cmc.ec.gc.ca/~afsdbrb/sea_surface_temperature/documentation/ghrsst_data_users_symposium_paper.pdfhttp://iweb.cmc.ec.gc.ca/~afsdbrb/sea_surface_temperature/documentation/ghrsst_data_users_symposium_paper.pdf
SST retrievals (°C) from the NOAA/NESDIS VIIRS dataset (left) and from the combination of three NAVO AVHRR datasets (right) for 24 Sept. 2014
Pour le cas de la typhoon Neoguri: 7 observations Argo pour la période de 4 jours (5 juillet - 8 juillet) dans la région (16N- 26N et 124E - 136E). • Le biais pour l'analyse opérationnelle est +2.1 K comparé à +1.1 K pour la nouvelle analyse (0.1 deg). • L'erreur RMS pour l'analyse opérationnelle est 2.4 K comparé à 1.3 K pour la nouvelle analyse.