Download
1 / 21
210 likes | 304 Views
UW ’ s Experimental Global Surface Water Monitor. http://www.hydro.washington.edu/forecast/global_monitor/. Forcing data. Precipitation data sets used: Princeton: 1948-2008 (T and P) TRMM V6: 1998 – 2011/06 TRMM RT: Uncalibrated 2005/02-current Temperature data sets used:

E N D
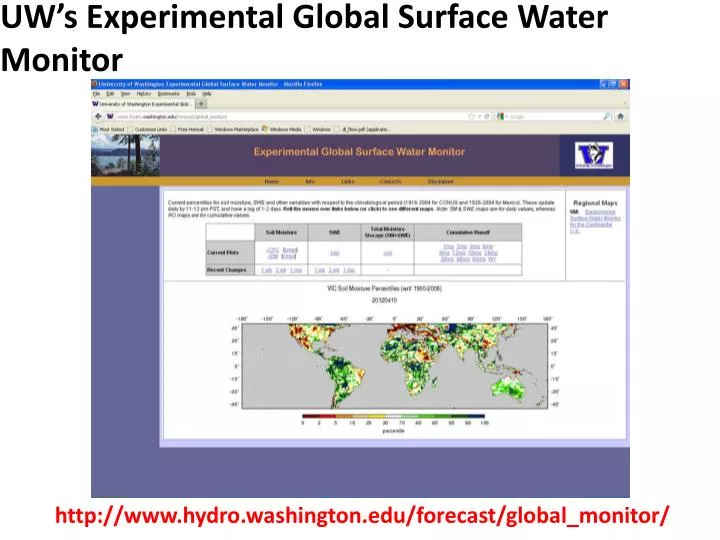
UW’s Experimental Global Surface Water Monitor http://www.hydro.washington.edu/forecast/global_monitor/
Forcing data • Precipitation data sets used: • Princeton: 1948-2008 (T and P) • TRMM V6: 1998 – 2011/06 • TRMM RT: Uncalibrated 2005/02-current • Temperature data sets used: • Princeton: 1948-2008 • NCEP/NCAR Reanalysis: 1979-2011 • GFS 4: 2010-current
Temperature Adjustment • For period 2009-2011: • Interpolate reanalysis to 0.5 degrees • Calculate mean monthly offset from Princeton data set for the period 1979-2008 • Impose calculated offset for each month on interpolated reanalysis for the period 2009-2011 • For RT (post 2011): • Interpolate GFS4 analysis field (000 lead time) to 0.5 degrees • Calculate mean monthly offset from reanalysis for the period 2010-2011 • Impose both calculated offsets for each month on interpolated GFS4 for the period post 2011 (so that GFS4 looks like the Princeton dataset)
Precipitation Adjustment • For period 2009-June 2011: • Use TRMM V6 • Calculate mean monthly ratio between TRMM V6 and the Princeton data set for the period 1998-2008 (see next slide for detail) • Multiply TRMM V6 with the monthly ratios for the period 2009 - June 2011 • For RT (post June 2011): • Use TRMM RT uncalibrated • Calculate mean monthly ratio between TRMM V6 and TRMM RT for the period Feb 2005 – June 2011 • Multiply TRMM RT with both calculated ratios for each month for the period post June 2011 (so that GFS4 looks like the Princeton dataset)
Precipitation Adjustment Example: Precipitation ratio for July between TRMM RT and Princeton data set (i.e. this is the product of the two ratios discussed previously) Next slide has July 2011 from TRMM RT (top) and adjusted (bottom) Note that the high adjustments are mostly in areas that are often rather dry in July
Precipitation Adjustment Difference between adjusted and raw TRMM RT for the same month
Anomaly of the most recent three years to the base period after adjustment
Global mean anomalies Not sure base period is the same. Left plot is our adjusted precip, bottom is an NCDC estimate Compare with: http://www.ncdc.noaa.gov/sotc/service/global/global-prcp-anom/201101-201112.gif
Global mean anomalies Same plot, but with unadjusted precipitation (red) shown as well. Note the big jump in 2011 when we start using TRMM RT. Obviously adjustment is necessary Compare with: http://www.ncdc.noaa.gov/sotc/service/global/global-prcp-anom/201101-201112.gif
Historical Drought Events • 1952 drought in the U.S. • 1965 drought in Australia • 1983 drought in Africa
Precipitation Adjustment One more example: TRMM V6 2010 annual total Next slide has adjusted values for 2010 (top) and adjustment (bottom)
1952 drought in the U.S.(As depicted by the Global Surface Water Monitor) Noah 2.8 VIC
1952 drought in the U.S.(As depicted by the U.S. Surface Water Monitor) Noah 2.8 VIC
1965 drought in Australia Noah 2.8 VIC
1983 drought in Africa Noah 2.8 VIC
Recent Droughts VIC (As of August, 2011) Texas Drought Horn of Africa Drought
Headlines on developing drought in Europe: http://www.businessweek.com/news/2012-03-22/european-crops-damaged-by-winter-freeze-now-face-drought http://www.fwi.co.uk/Articles/28/03/2012/132169/Wheat-prices-rise-as-European-drought-fears-grow.htm http://www.aljazeera.com/weather/2012/03/20123291072795347.html