Download
1 / 13
140 likes | 151 Views
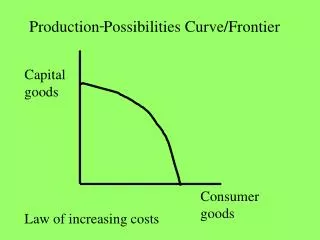
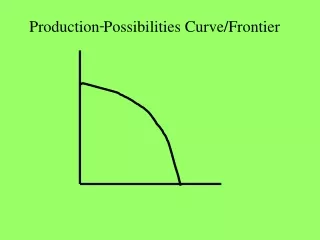
The Production Possibilities Curve. The production possibilities frontier (the line) shows all the possible combinations of the two products using all the available resources .

E N D
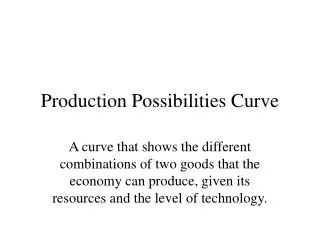
The production possibilities frontier(the line) shows all the possible combinations of the two products using all the available resources. • Since we are using all available resources, increasing the production of one of the goods means decreasing the production of the other good (illustrates idea of scarcity). • The decrease in production is the opportunity cost (we had to give up some of one good to get more of the other).
Smarties Production Possibilities Frontier A 50 B 40 Lose 20 Smarties (opportunity cost) 30 C 20 Gain 20 Dum-Dums 10 D 0 25 50 70 75 Dum-Dums
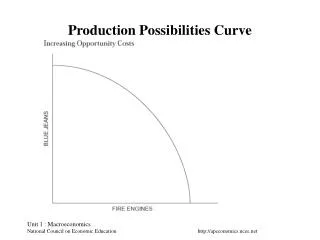
Opportunity costs are not constant along the frontier. • As resources are moved from the production of Smarties to Dum-Dums, increasingly larger amounts of Smarties must be given up to get decreasingly smaller amounts of Dum-Dums. • This is known as the Law of Increasing Costs. • This happens because resources are not equally suited to the production of both goods.
Smarties A 50 Lose 10 Smarties B 40 Lose 20 Smarties 30 C 20 Gain 50 Dum-Dums Gain 20 Dum-Dums 10 D 0 25 50 70 75 Dum-Dums
It is possible to produce at any point on the frontier or inside the frontier • Only points on the frontier are efficient. • Any point inside of the frontier is inefficient and shows an underutilization of resources. • When moving from inside the frontier to the frontier there is no opportunity cost because resources were underutilized.
Smarties A Efficient production 50 B 40 Inefficient Production or Underutilization of resources F 30 C 20 10 D 0 25 50 70 75 Dum-Dums
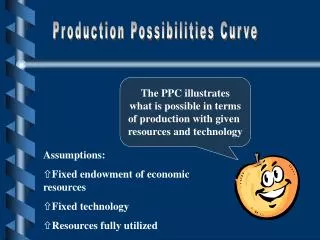
Production outside of the frontier is not possible with current available resources. • If there is an increase in land, labor or capitalOR technology then the frontier will shift outwards. • A shift out means that more of both products can be produced.
Point G not possible with current resources or technology Smarties A 50 G B 40 30 With more resources or technology the line shifts outward C 20 10 D 0 25 50 70 75 Dum-Dums
Nations must make choices about how to use their available resources (guns and butter). • An increase in the production of military goods (guns) will cause a decrease in the production of consumer goods (butter). • The production possibilities curve can also demonstrate unemployment within an economy (point inside the curve) and economic growth (this curve shifts out).
Guns A Economic Growth of Economy 50 B 40 30 Lose 20 Guns U C Unemployed land, labor or capital 20 Gain 20 Butter 10 D 0 25 50 70 75 Butter
A PRODUCTIONS POSSIBILITIES CURVES A B B
C C D D

![Production Possibilities Curve [ better known as the “PPC”]](https://cdn1.slideserve.com/2233211/slide1-dt.jpg)