Download
1 / 13
140 likes | 314 Views
The Production Possibilities Curve. Illustrating Opportunity Cost Fall 2013. I. The Production Possibilities Frontier (curve). Illustration of the trade-offs facing an economy, modeling only two goods

E N D
The Production Possibilities Curve Illustrating Opportunity Cost Fall 2013
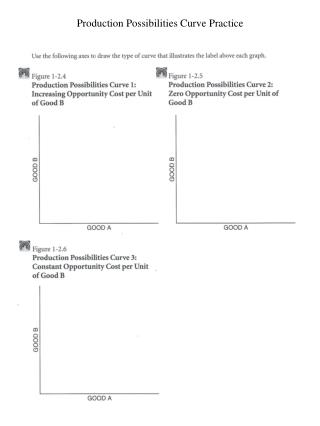
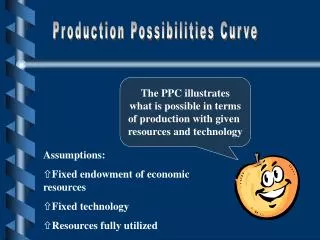
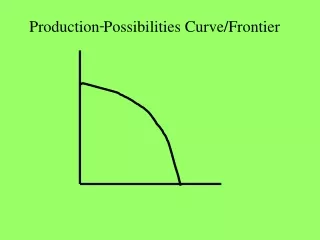
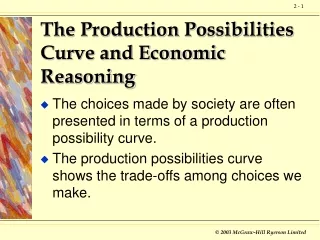
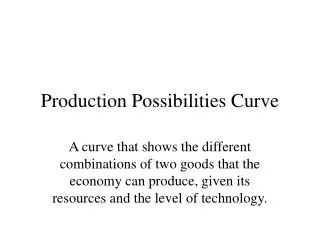
I. The Production Possibilities Frontier (curve) • Illustration of the trade-offs facing an economy, modeling only two goods • Shows the maximum quantity of one good that can be produced for any given production of the other • Visual representation of efficiency, opportunity cost – and often growth
The Production Possibility Frontier D 30 Quantity of coconuts A 15 B 9 C 0 20 28 40 Quantity of fish
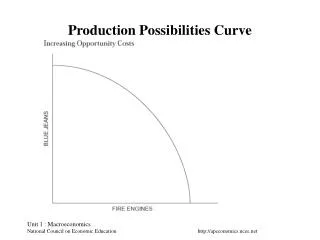
Increasing Opportunity Cost 35 30 Quantity of coconuts A 25 20 15 10 5 0 10 20 30 40 50 Quantity of fish
Economic Growth 35 E 30 Quantity of coconuts A 25 20 15 10 5 Original New PPF PPF 0 10 20 25 30 40 50 Quantity of fish
PPC Practice • Draw a PPC showing changes for each of the following: • Pizza and Robots • New robot making technology • Decrease in the demand for pizza • Mad cow disease kills 85% of cows • Consumer goods and Capital Goods • BP oil spill in the Gulf • Faster computer hardware • Many workers unemployed • Significant increases in education
Question #1 New robot making technology Quantity of Robots Quantity of Pizzas 7
Question #2 Decrease in the demand for pizza Quantity of Robots Quantity of Pizzas 8
Question #3 Mad cow disease kills 85% of cows Quantity of Robots Quantity of Pizzas 9
Question #4 BP Oil Spill in the Gulf Quantity of Capital Goods Quantity of Consumer Goods 10
Question #5 Faster computer hardware Quantity of Capital Goods Quantity of Consumer Goods 11
Question #6 Many workers unemployed Quantity of Capital Goods Quantity of Consumer Goods 12
Question #7 Significant increases in education Quantity of Capital Goods Quantity of Consumer Goods 13

![Production Possibilities Curve [ better known as the “PPC”]](https://cdn1.slideserve.com/2233211/slide1-dt.jpg)