Download
1 / 8
140 likes | 430 Views
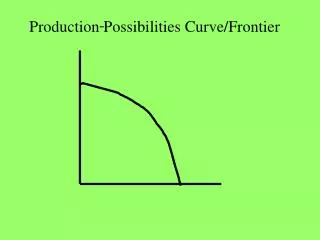
Production Possibilities Curve. What to produce...in what amount?. What Goods to Produce?. Economists look at this question and create what is known as the Production Possibility Curve or Frontier. 4 Assumptions. Featuring the following simplifying assumptions…

E N D
Production Possibilities Curve What to produce...in what amount?
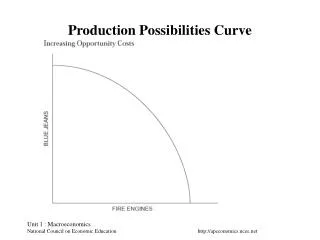
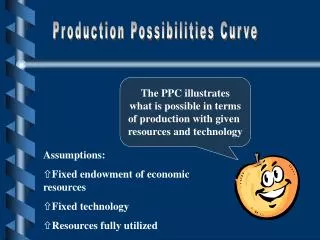
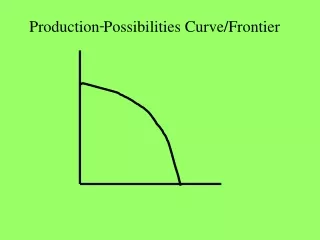
What Goods to Produce? • Economists look at this question and create what is known as the Production Possibility Curve or Frontier
4 Assumptions • Featuring the following simplifying assumptions… • a society that produces only two goods • the efficient use and full employment of resources • fixed technology • a single snapshot in time
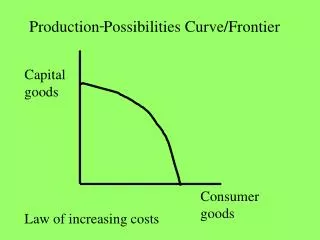
Production Possibilities Curve Peanuts At this Point What is Being Produced in Greater Quantity? How many Oranges are being produced at this point? Why does the Production ofthese two products follow a curve? • It is bowed out to denote increasing costs Representation of production at itsmost efficient Important to realize that production can also take place anywhere within the curve. Oranges
Production Possibilities Curve Why would the curve shiftinward? Peanuts • Problems with Labor • Loss of Land Resources • Machinery Breaks Down When the economy/business uses less resources than the economy is capable of using it experiences… UNDERUTILIZATION Oranges
Production Possibilities Curve Why would the curve shiftoutward? Peanuts • Increase in the Amount or Quality of Resources • More Labor (Population) • Increased Productivity from Labor • New or Better Resources • New or Better Capital • Better Education or Health of Labor • Technological Advancement Future Production Possibilities Frontier Oranges
Production Possibilities Graph 25 20 15 10 5 Watermelons (millions of tons) Shoes(millions of pairs) 0 15 a (0,15) 8 14 b (8,14) 14 18 20 21 12 9 5 0 Shoes (millions of pairs) c (14,12) d (18,9) e (20,5) A production possibilities frontier f (21,0) 0 5 10 15 20 25 Watermelons (millions of tons) Production Possibilities Graph
Events that can expand production possibilities outward… • A technological advance • rail cars • refrigeration • computers • An increase in human or natural resources • population increase • new discoveries • Capital investment • new factories • new infrastructure