Download
1 / 15
150 likes | 238 Views
IB404 - 16 - Human genome 2 – Mar 14.

E N D
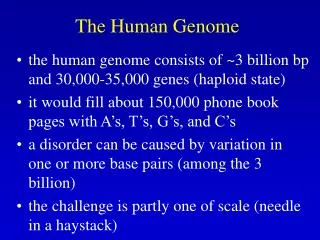
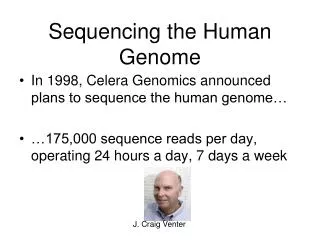
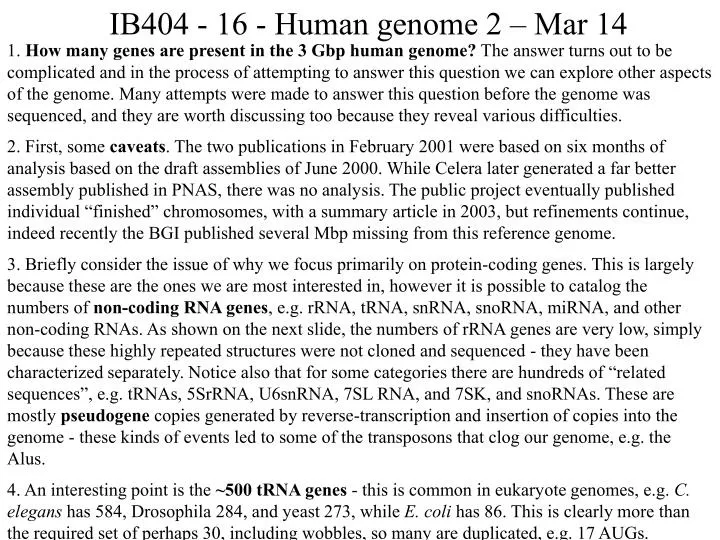
IB404 - 16 - Human genome 2 – Mar 14 1. How many genes are present in the 3 Gbp human genome? The answer turns out to be complicated and in the process of attempting to answer this question we can explore other aspects of the genome. Many attempts were made to answer this question before the genome was sequenced, and they are worth discussing too because they reveal various difficulties. 2. First, some caveats. The two publications in February 2001 were based on six months of analysis based on the draft assemblies of June 2000. While Celera later generated a far better assembly published in PNAS, there was no analysis. The public project eventually published individual “finished” chromosomes, with a summary article in 2003, but refinements continue, indeed recently the BGI published several Mbp missing from this reference genome. 3. Briefly consider the issue of why we focus primarily on protein-coding genes. This is largely because these are the ones we are most interested in, however it is possible to catalog the numbers of non-coding RNA genes, e.g. rRNA, tRNA, snRNA, snoRNA, miRNA, and other non-coding RNAs. As shown on the next slide, the numbers of rRNA genes are very low, simply because these highly repeated structures were not cloned and sequenced - they have been characterized separately. Notice also that for some categories there are hundreds of “related sequences”, e.g. tRNAs, 5SrRNA, U6snRNA, 7SL RNA, and 7SK, and snoRNAs. These are mostly pseudogene copies generated by reverse-transcription and insertion of copies into the genome - these kinds of events led to some of the transposons that clog our genome, e.g. the Alus. 4. An interesting point is the ~500 tRNA genes - this is common in eukaryote genomes, e.g. C. elegans has 584, Drosophila 284, and yeast 273, while E. coli has 86. This is clearly more than the required set of perhaps 30, including wobbles, so many are duplicated, e.g. 17 AUGs.
5. Other RNA-only genes (“dark matter”). Since this original compilation the subject of microRNAs has gained wide study, along with the long non-coding RNAs or lncRNAs. Various studies have shown that at least in some cells at some point, almost every part of our genome is transcribed, but exactly what it all that RNA is doing remains controversial. The Table below is from a pair of Forum articles in Nature this year (482: 310-311), and the articles are copied for you to read. Note that there are ~15,000 lncRNAs listed here, with functions ascribed to just a few of them, all in regulating expression of “normal” protein-coding genes.
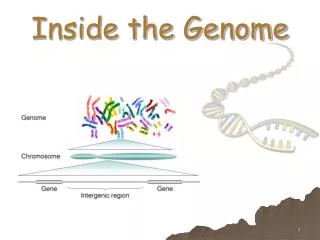
6. One story has it that Walter Gilbert at Harvard (inventor of the alternative degradation sequencing method) once made a back-of-an-envelope calculation that since the average human protein-coding gene was about 30 kbp, and the genome was 3 Gbp, there should be around 100,000 genes, and this nice round number became widely mentioned in the 1980s. The problem is that many genes are a whole lot bigger than that, and they had not been cloned and sequenced as genes, just cDNAs. Intergenic regions can also be big. 7. Other early estimates of the number of protein-coding genes depended on lots of indirect evidence. For example, about 2/3 of known human genes have a CpG-rich region, known as a CpG island, near their 5’ or promoter region and commonly overlapping the first exon. These are typically 500-2000bp long, and are not methylated on the C. They appear to be important for some kinds of promoter activation. Estimates of the number of CpG islands in the human genome ranged from 30-60,000 depending on how they were classified. This suggested that the genome had 50-100,000 genes, but unfortunately it turns out that some of the most common Alu retrotransposons in our genome have CpG-like regions that misled this count. 8. Subsequent estimates were based on the numbers of different EST sequences generated from hundreds of cDNA libraries generated from innumerable organs, tissues, life stages, cell lines. Indeed Venter and TIGR started out on the human genome by generating many hundreds of thousands of these. Today there are roughly 10 million such human ESTs in the public databases alone. A company called InCyte made a particularly big deal of these and announced that they could define ~120,000 different EST contig sequences, suggesting that there were this many different genes, largely in support of their sales of their own microarrays with all of these on them, but it turns out that most of these are alternative splice products, pseudogene transcripts, and contaminating DNA, although some may be interesting non-coding RNAs.
9. These and several other lines of evidence convinced most biologists that the human genome contained 50-80,000 protein-coding genes, so it was rather a big surprise when these two genome papers were published, each cataloging roughly 25-30,000 genes. Today, if anything, the total is decreasing due to continued recognition of false positives, primarily pseudogenes, and some feel the total is no more than ~20,000 protein-coding genes. 10. There are two major kinds of pseudogenes. Some are duplicated copies of genes that slowly degraded by accumulating incapacitating mutations, such as crucial amino acid changes, in-frame stop codons, and small frameshifting indels, or large indels. The most common normal pseudogenes are ~600 olfactory receptor pseudogenes, versus ~300 functional OR genes. But many pseudogenes in the human and other mammalian genomes are retropseudogenes or processed pseudogenes, which appear to be reverse transcribed cDNA copies that have been inserted elsewhere into the genome. They are easily recognized by the absence of introns, their 5’ ends correspond to the initiation of transcription region because they are derived from the 5’ UTR or truncated versions of this, and their 3’ ends are usually long A-rich stretches because they are derived from the poly-A tail of the mRNA. There are retropseudogene copies of almost every protein-coding gene. But the most frequent retropseudogenes are derived from the many ribosomal protein genes, perhaps because they are transcribed so much to make ribosomes. 11. I’ve mentioned the many pseudogene copies of various non-coding RNAs, and these appear to be some of the biggest sources of pseudogenes in our genome, perhaps because they are transcribed by RNA polymerase III. RNA Pol III genes have their promoter between the start of transcription and the functional RNA sequence, hence a RT version of them that gets inserted into the genome carries its promoter with it and can go on being transcribed, giving rise to still more pseudogenes, ad infinitum! Hence some evolved into retrotransposons.
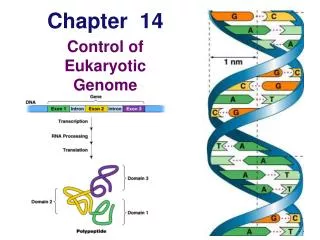
12. Now that we had a very large set of human protein-coding genes, it’s possible to extract some comparative information from them. For example, average human exonsare generally shorter than fly or worm exons, apparently because human genes have retained most of their original introns, while many introns have been lost from fly and worm genes, thus fusing their exons and making their exons longer on average. The medianlength for human exons is the same as fly and worm at about 120 bp, but the tail of the distribution of exon size is much longer in flies and worms. Nevertheless there are some large human exons, e.g. the titin exon of 17 kb. 13. Intron length also differs greatly, with introns generally far larger in humans and a far longer tail on the size distribution. I believe the largest known intron in humans is around 500 kbp. As shown in the UCSC browser slide last lecture, most of this is “junk” DNA in the form of transposons. In worms and flies there is a clear peak of short intron lengths at 50 and 60 bp respectively (their median length), while the peak in humans is around 90 bp. In flies and worms most very long introns involve the insertion of other genes in opposite orientation in the introns, but not in humans. And note that the shortest introns are about 40-60 bp.
14. The average protein length is around 450 aa, so the average coding length is ±1,400 bp. Thus the total nucleotides coding for amino acids is 1,400 X 20,000 = ~30 million bp or about 1% of the entire 3Gbp genome! 15. The average gene length in these initial compilations was around 30 kb, like Walter Gilbert’s original estimate, so then perhaps 30% of the genome would be transcribed, although more recent estimates based on longer cDNAs that include the 5’ UTR regions commonly encoded by distant 5’ exons before long first introns suggest that more than 50% of the genome, and some claim as much as 90%, of the genome is transcribed into pre-mRNA. 16. Genes are not spread uniformly along chromosomes. In addition to the gene-poor centromeric and telomeric regions, there are large-scale variations in gene content along chromosomes, sometimes called isochores. These regions alternate between relatively GC-rich and relatively AT-rich regions. The GC-rich regions are also gene-rich, while AT-rich regions are gene deserts with a few extremely long genes with very long introns. Alu/100kbp EST/100kbp Percent G+C Genes/Mbp
17. Here are the various GO functional categories for Celera’s 26,800 predicted proteins. Notice that we again had around 40% of genes in the unknown category.
18. GO functional categories for strict human-fly-worm orthologs, that is, conserved animal genes. 2758 human-fly orthologs, and 2031 human-worm orthologs (1523 in common between these sets). Notice that still 36% had no known function. 17. Here are the Go functional categories for
19. The public project undertook similar analyses for their ~25,000 proteins. Note that in this comparison of GO categories across the three major phyla, the large increases in humans (last column in each grouping) are in transcription/ translation, signaling, communication, cytoskeleton, defense and immunity.
20. A particularly compelling public analysis using BLASTP searches to find evolutionary homologs (not just strict orthologs) for all human proteins suggests that roughly a quarter (~5000) are vertebrate-specific, another quarter are animal-specific, another quarter are eukaryote-specific, and the last quarter are truly ancient, being shared with prokaryotes. Note that just 1% had no animal homology at that time, before the mouse genome was sequenced, so the vast majority of our genes/proteins are at least 500 myr old - that is in vertebrates. The prokaryotes-only category here was an embarrassing mistake; there are few if any genes in our genome whose only relatives are in bacteria - they are possible horizontal transfers from bacteria.
21. Both papers discussed extensively the categories and types of proteins that are vertebrate-specific in comparison with flies and worms, let alone plants and yeasts. We can’t do this justice, but here are a few. There are obvious categories like the immunoglobulins of our immune system and all the other proteins involved in the adaptive immune system (not the innate system, which is ancient in animals and shared at least with flies). Others include the ~1000 olfactory and other chemosensory receptors, and large numbers of hormones and their receptors, since a lot of our development and homeostatic regulation uses these. Here’s a huge summary table from the Celera paper, broken into major categories, e.g. neural, etc.. Panther family/subfamily* H F W Y A Neural structure, function, development Ion channels Acetylcholine receptor 17 12 56 0 0 Amiloride-sensitive 11 24 27 0 0 CNG/EAG 22 9 9 0 30 IRK 16 3 3 0 0 ITP/ryanodine 10 2 4 0 0 Neurotransmitter-gated 61 51 59 0 19 P2X purinoceptor 10 0 0 0 0 TASK 12 12 48 1 5 Transient receptor 15 3 3 1 0 Voltage-gated Ca2+ alpha 22 4 8 2 2 Voltage-gated Ca2+ alpha-2 10 3 2 0 0 Voltage-gated Ca2+ beta 5 2 2 0 0 Voltage-gated K+ alpha 33 5 11 0 0 Voltage-gated KQT 6 2 3 0 0 Voltage-gated Na+ 11 4 4 9 1 Myelin PO 5 0 0 0 0 Myelin proteolipid 3 1 0 0 0 Myelin glycoprotein 1 0 0 0 0 Plexin 9 2 0 0 0 Semaphorin 22 6 2 0 0 Synaptotagmin 10 3 3 0 0
Panther family/subfamily* H F W Y A Immune response Defensin 3 0 0 0 0 Cytokine 86 14 1 0 0 GCSF 1 0 0 0 0 GMCSF 1 0 0 0 0 Intercrine alpha 15 0 0 0 0 Intercrine beta 5 0 0 0 0 Inteferon 8 0 0 0 0 Interleukin 26 1 1 0 0 Leukemia inhibitory factor 1 0 0 0 0 MCSF 1 0 0 0 0 Peptidoglycan protein 2 13 0 0 0 Pre-B cell enhancing factor 1 0 0 0 0 Small inducible cytokine A 14 0 0 0 0 Sl cytokine 2 0 0 0 0 TNF 9 0 0 0 0 Cytokine receptor 62 1 0 0 0 Bradykinin/C-C receptor 7 0 0 0 0 Fl cytokine receptor 2 0 0 0 0 Interferon receptor 3 0 0 0 0 Interleukin receptor 32 0 0 0 0 Leukocyte kinase receptor 3 0 0 0 0 MCSF receptor 1 0 0 0 0 TNF receptor 3 0 0 0 0 Immunoglobulin receptor 59 0 0 0 0 T-cell receptor alpha chain 16 0 0 0 0 T-cell receptor beta chain 15 0 0 0 0 T-cell receptor gamma chain 1 0 0 0 0 T-cell receptor delta chain 1 0 0 0 0 Immunoglobulin FC receptor 8 0 0 0 0 Killer cell receptor 16 0 0 0 0 MHC class I 22 0 0 0 0 MHC class II 20 0 0 0 0 Other immunoglobulin 114 0 0 0 0 Toll receptor-related 10 6 0 0 0
Panther family/subfamily* H F W Y A Developmental and homeostatic regulators - I removed some of these and below too Calcitonin 3 0 0 0 0 Ephrin 8 2 4 0 0 FGF 24 1 1 0 0 Glucagon 4 0 0 0 0 Insulin-like hormone 4 0 0 0 0 Nerve growth factor 3 0 0 0 0 Neuregulin/heregulin 6 0 0 0 0 neuropeptide Y 4 0 0 0 0 Relaxin 3 0 0 0 0 TGF-like 29 6 4 0 0 VEGF 4 0 0 0 0 Wnt 18 6 5 0 0 Ephrin receptor 12 2 1 0 0 FGF receptor 4 4 0 0 0 Frizzled receptor 12 6 5 0 0 PTH receptor 2 0 0 0 0 VEGF receptor 5 0 0 0 0 Nerve GF receptor 4 0 0 0 0 Kinases and phosphatases Protein phosphatase 29 8 10 4 11 kinase 395 198 315 114 1102 S/T protein phosphatase 15 19 51 13 29 Y protein kinase 106 47 100 5 16 Y protein phosphatase 56 22 95 5 6 Signal transduction ARF family 55 29 27 12 45 Nucleotidphosphodiesterase 25 8 6 1 0 G protein-coupled receptors 616 146 284 0 1 G-protein alpha 27 10 22 2 5 G-protein beta 5 3 2 1 1 G-protein gamma 13 2 2 0 0 Ras superfamily 141 64 62 26 86 ARF GTPase-activating 20 8 9 5 15 RasGTPase-activating 9 3 8 1 0 Vav proto-oncogene family 35 15 13 3 0
Panther family/subfamily* H F W Y A Transcription factors/chromatin organization - I removed a lot of these and below categories C2H2 zinc finger 607 232 79 28 8 CREB 7 1 2 0 0 Forkhead-related 34 19 15 4 0 Histone H1 5 0 1 0 0 Histone H2A 24 1 17 3 13 Histone H2B 21 1 17 2 12 Histone H3 28 2 24 2 16 Histone H4 9 1 16 1 8 Homeotic 168 104 74 4 78 Distal-less 5 2 1 0 0 Engrailed 2 2 1 0 0 LIM-containing 17 8 3 0 0 MEIS/KNOX class 9 4 4 2 26 Paired box 38 28 23 0 2 Leucine zipper 6 0 0 0 0 Nuclear hormone receptor 59 25 183 1 4 ECM adhesion Cadherin 113 17 16 0 0 Claudin 20 0 0 0 0 Integrin alpha 24 7 4 0 1 Integrin beta 9 2 2 0 0 LDL receptor family 26 19 20 0 2 Proteoglycans 22 9 7 0 5 Apoptosis Bcl-2 12 1 0 0 0 Calpain 22 4 11 1 3 Calpain inhibitor 4 0 0 0 1 Caspase 13 7 3 0 0 Other enzymes Cytochrome p450 60 89 83 3 256 GAPDH 46 3 4 3 8 Splicing and translation EF-1alpha 56 13 10 6 13 Ribonucleoproteins 269 135 104 60 265 Ribosomal proteins 812 111 80 117 256