Download
1 / 31
310 likes | 448 Views
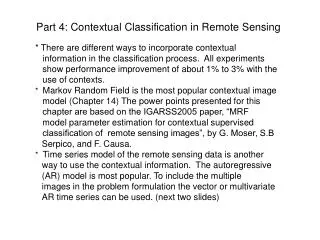
Contextual Classification. by Melanie Ganz Lecture 6, Medical Image Analysis 2008. Predicted labels. Overlap. Labels. Data. Motivation. Motivation. The KNN pixel classifier we use in the CVD project does not use contextual information.

E N D
Contextual Classification by Melanie Ganz Lecture 6, Medical Image Analysis 2008
Predicted labels Overlap Labels Data Motivation
Motivation The KNN pixel classifier we use in the CVD project does not use contextual information. But what kind of methods are there that take advantage of contextual information? Before we get into that, we need to take a look at what context means and learn about the mathematical way of describing structures. To do this we return to physics..... But we have enough sample data to try to acquire contextual information (e.g. joint probability distribution) from it!
Ising-Model A magnet can be thought of as a a grid, on which at every grid point we have a small arrow, which represents the spin of the atom sitting there. The magnetisation of the complete magnet can then be described as the difference between up and down spins. Spins si with +1 or -1 Net Magnetisation
Ising-Model on Images We can think of an image as being the same thing: The gridpoints are our pixels and the intensities can be divided into e.g. two classes (in this example case red and yellow equals +/- 1). Just as we can calculate the net magnetisation in a magnet, we can calculate a similar, global entity for an image.
Ising-Model on Images Instead of calculating the magnetisation we calculate the energy state of our image (we could have done the same thing for the magnet). There are many different formulations to calculate the energy. Let us stick to our example before and borrow the energy formulation for a magnet: Sigma and H are only constants and s are the spins with value +/- 1.
Ising-Model on Images This way we can calculate an energy value E for every configuration of our 5 by 5 grid. Some configurations will end up having the same energy value, what should one do about that? We need to know how probable the energy value we calculate for an image is!
Ising-Model on Images We convert our energy into a probability by using an analogy from physics (we assume that particles are Boltzmann distributed). This way we get: Z is a normalizing factor (the partition function), E is the energy we calculate and T is the temparature that the system/image is in.
Ising-Model on Images Knowing the energy value of a configuration and the probability of the configuration we can tackle the question: What colour should our green pixel be? The most probable state of the whole image will be the one with minimal energy. Therefore we decide to minimize the global energy function by choosing our pixel to be either red or yellow.
Different methods • There are many different methods to minimize the global energy function of a system. I will try to briefly explain three of them: • Markov Chain Monte Carlo Methods • Simulated Annealing (Geman,Geman,”Stochastic Relaxation, Gibbs Distributions, and the Bayesian Restoration of Images”, 1984) • Graph Cuts (http://www.cs.cornell.edu/~rdz/Papers/KZ-PAMI04.pdf) • To understand those methods it is important to have some knowledge of Markov Chains (MC) and Markov Random Fields (MRF) • (Li, “Markov Random Field Modelling in Image Analysis”, 2001, p. 1-42).
Markov Chains Markov Chains are time series (i.e. there is a clear ordering of observations), where : This means that the probability of the outcome of the next step depends only on the step directly before. It doesn’t involve steps that are ”older”.
Markov Random Fields Sites are the basic entity, e.g. pixels, and can be regular or irregular. Labels are the ‘values’ these sites can take, e.g. pixel values or classes. A neigborhood N, given a set of sites S, is given by N = {Ni} for all i in S.
Markov Random Fields Random Fields are... In an MRF, the sites in S are related to one another via a neighborhood system, which is defined as N = {Ni, i in S}. Here Ni is the set of sites neighbouring i, for i not equal to Ni and i in Nj as well as j in Ni. A random field X is said to be an MRF on S with respect to a neighbourhood system N if and only if
Questions? • Everything clear? • What have we talked about? • What are the basic concepts? • What do you need now?
A Break http://www.phdcomics.com/
Different methods • Markov Chain Monte Carlo Methods • Simulated Annealing • Graph Cuts
Markov Chain Monte Carlo Methods • There are different examples of Markov Monte Carlo Methods: • Random walk algorithms • Metropolis Hastings algorithm: • This is an algorithm that creates a Markov chain that can reproduce samples that stem from a probability distribution that can not be sampled directly. Then from the samples the distribution can be approximated. • (https://people.scs.fsu.edu/~beerli/mcmc/metropolis-et-al-1953.pdf, • http://biomet.oxfordjournals.org/cgi/content/abstract/57/1/97) • Gibbs sampling: special case of the above algorithm. • and more... • Avoiding random walks • There are also other algorithms that avoid to use a random walk, but rather direct their steps.
Simulated Annealing Simulated annealing: probabilistic algorithm for global optimization problems. It aims at locating a good approximation to the global minimum of a given function. The name and inspiration come from a technique called annealing in metallurgy. This technique involves heating and controlled cooling of a material. The heat causes the atoms to oscillate and wander randomly through states of higher energy. The following slow cooling gives them more chances of finding configurations with lower energy than the initial one.
Simulated Annealing The idea is that we first perturb (=”kick”) the parameters of the sytem and therefore ”heat” it up. Then we ”cool” it down again and let is assume a hopefully energetically more advantegous state. By doing this a couple times we can reach the global energy minimum.
a cut t t s s Graph Cuts sink source We look at the image as if it would be a MRF. Then we try to find the cut through the graph with the minimal cost, which can be found with the Ford-Fulkerson algorithm.
The Ford-Fulkerson Algorithm This is a directed graph.
The Ford-Fulkerson Algorithm We find a path through the graph.
The Ford-Fulkerson Algorithm We push as much flow as possible through it.
The Ford-Fulkerson Algorithm We find a new path through the graph.
The Ford-Fulkerson Algorithm Again we push as much flow as possible through it.
The Ford-Fulkerson Algorithm We find yet another path through the graph.
The Ford-Fulkerson Algorithm And push flow through the graph.
The Ford-Fulkerson Algorithm Now the graph has no paths left; no more flow can be pushed through it. The maximal flow we achieved is 23.
Maximum Flow & Minimum Cut The maximum flow is the flow that can maximally be pushed through a graph. A minimum cut is a cut of the graph with minimal cost. The minimum cut is found at saturated edges (edges where the flow has been exhausted). With neighbor interactions Without neighbor interactions
Questions? • More Questions? • Exercises...
Exercises % This script gives a small introduction into graph cuts and how to use % them. % % Melanie Ganz, April 2008 % (ganz@diku.dk) clear all close all disp('Running') nNodes=4; %Node,source,sink TerminalWeights=[ 1,16,0; 2,13,0; 3,0,20; 4,0,4] %From,To,Capacity,Rev_Capacity EdgeWeights=[ 1,2,10,4; 1,3,12,0; 2,3,0,9; 2,4,14,0; 3,4,0,7 ] mex GraphCutMex.cpp MaxFlow.cpp graph.cpp [Cut,Flow]=GraphCutMex(nNodes,TerminalWeights,EdgeWeights) disp(' ')