Download
1 / 24
240 likes | 370 Views
Contextual effects. In the previous sections we found that when regressing pupil attainment on pupil prior ability schools vary in both intercept and slope resulting in crossing lines. .

E N D
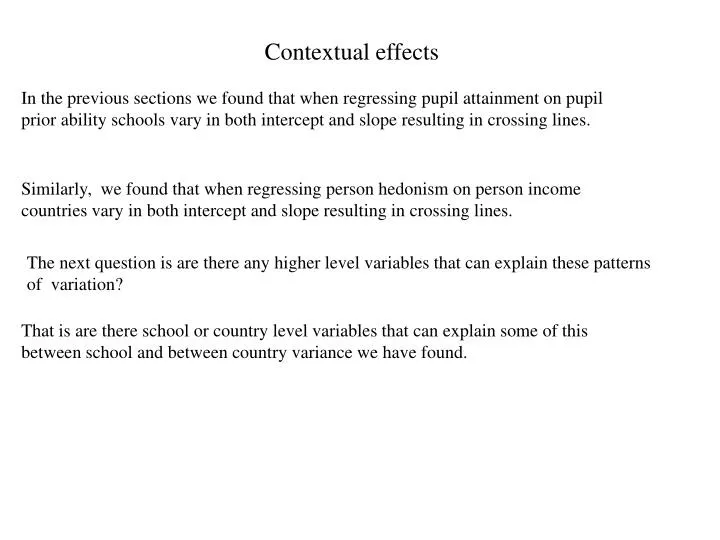
Contextual effects In the previous sections we found that when regressing pupil attainment on pupil prior ability schools vary in both intercept and slope resulting in crossing lines. Similarly, we found that when regressing person hedonism on person income countries vary in both intercept and slope resulting in crossing lines. The next question is are there any higher level variables that can explain these patterns of variation? That is are there school or country level variables that can explain some of this between school and between country variance we have found.
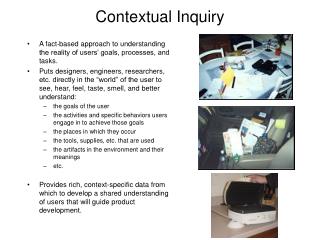
Example Research questions • Interest lies in how the outcome of individuals in a cluster is affected by their social contexts (measures at the cluster level). Typical questions are • Does school type effect students' educational progress? • Do teacher characteristics effect students' educational progress? • Is a students progress effected by the ability of his or her peers? • Does area deprivation effect the health status of individuals in the area? • Children within families is also a multilevel structure. Does family background effect child developmental outcomes?
An Educational example A question of widespread interest is do children make better academic progress in single or mixed. This is a question about the contextual effect of school gender on child progress. Consider a random intercept model on our educational data set
Including school gender contextual effects Make inference that girls in girl schools progress better than girls in mixed schools. Z=0.245/0.85=2.9, p=0.005 Do not make inference that boys in boy schools progress better than boys n mixed schools. Z=0.097/0.109=0.89, p=0.390
Between pupil variance unchanged, addition of higher level variables cannot alter variance at lower levels Comparing the models with and without contextual effects Between school variance reduced by 13% as a result of fitting school gender
Comparing random intercept contextual effects model, with single level contextual effects model Inference changes, under single level model we infer boys do better in single sex schools. Single level models which ignore clustering will give rise to mis-estimated precision, particularly for contextual effects. Why?
Mis-estimated precision In this data set we have 4059 pupils in 65 schools. We therefore only have 65 independent bits of information with which to identify the school effects. The standard errors calculated for the single level model assume we have 4059 bits of information. With level 1 predictors we also get mis-estimated precision because the clustering at higher levels induces correlations between individuals in the same group, so we also have less than 4059 bits of information. However, the problem is typically far less severe. Indeed in the above analysis there are no differences between the standard errors for the coefficients of level 1 predictor variable prior ability between the single level and random intercept models.
Why not just include dummy variables for each school in the ‘single’ level model This would be the equivalent of fitting an analysis of covariance model. Unfortunately this will not work. We only have 65 pieces of information at the school level and if we use this up by fitting 65 dummy variables we can add no more variables at the school level. So we can not add the school gender dummies. Multilevel modelling provides a richer and more accurate exploratory framework for modelling contextual effects. We get the right standard errors We can see how much of the higher level variation was explained by the contextual effects and how much remains.
Within group, between group and contextual effects of for level 1 predictors Often contextual variables are constructed by aggregating level 1 predictors, country level income, family level aggression etc We will simulate a small data set with 100 individuals from four groups, for the sake of argument lets say that our response is happiness, we have a predictor variable that is income and the groups are 4 different countries. Lets simulate the mean income in each country as 2,4,6,8. We then simulate our response as Note that this model does not include a country level random effect. Therefore the only differences between country happiness levels are produced by differing incomes in the countries.
Fitting a regression model ignoring average income And we might conclude as income rises happiness reduces
Including the average income variable Now we have a different picture. Within all countries the relationship between income and happiness is positive. This is the within country slope(1.128) However the intercept for country j is 5.772 - 2.32 av_incomej -2.32 is the contextual effect. Recall the country average incomes are {2,4,6,8}, which gives intercepts of {1.13,-3.51, -8.15, -12.8} Now within all countries we have a positive relationship between income and happiness, however people in richer countries tend to be less happy than poorer ones.
What about the between group effect? We have identified the within group and contextual effects of the income predictor. The between group effect is the slope of the regression of the country mean for happiness on the country mean for income. That is the slope of the regression line through the four red points and is -1.20 within group = 1.128 contextual = -2.332 between group = -1.204 Notice that the between group = the within group + the contextual B = W + C -1.204=1.128+(-1.204) Or C = B – W that is the contextual effect is the the difference of the between and within regressions
Examples of different contextual effects W=1,B= -1,C=-2 W = 1, B=1,C=0 W=1,B=3,C=2 Contextual effect pushes up intercept as av_income increases Contextual effect pulls down intercept as av_income increases Contextual effect 0 so intercept unchanged as av_income increases
Group mean centering of a level 1 predictor If we… Something interesting happens. In our example this corresponds to The intercept and within slope remain unchanged , but 2 now estimates the between group coefficient not the contextual coefficient for income…
Comparison of uncentered and group mean centered level 1 income predictor Note that if you grand mean centre income then 2 remains the contextual coefficient – ie behaves in the same way as the uncentered case
With group mean centering why is 2 the between group effect
And now to some real data.. Consider the random slopes model on the hedonism data where we regress hedonism on income Note income centered around grand mean of 6.
Adding contextual effect for income The contextual effect is positive but non-significant. If we obtain model predictions for a low(3.5) and high(8) average income country we obtain Low = (-0.278 + 0.016 3.5) + 0.043 income = -0.222 + 0.043 income High = (-0.278 + 0.016 8) + 0.043 income = -0.150 + 0.043 income Thus the positive contextual effect means countries with higher average incomes have higher intercepts and this has reduce the intercept variation by a small amount from 0.069 to 0.066
Cross-level interactions The fixed part of the previous model assumes the within country income slopes do not change as functions of country level variables. So the within country lines for low and high income countries are parallel. It may be that the with country income slopes may change as a function of the contextual variable av_income. We can test this assumption by allowing the within country income slopes to change as a function of av_income that is fit an interaction between income and av_income
Cross level interaction The cross level interaction is negative and statistically significant. The model predictions for countries with low and high average incomes are now Low = (-0.465 + 0.049 3.5) + (0.123 -0.137 3.5) income = -0.29 + 0.076 income High = (-0.465 + 0.049 8) + (0.123 -0.137 8) income = -0.08 +0.016 income
Interpreting the graph At low levels of individual income people in rich countries are more hedonistic. As individual income rises the rich-poor country differential diminishes For what incomes is the rich country-poor country gap significant?
Contextual effects explaining level 2 variance Given a random slope model Contextual variables explain level 2 variation in the intercept and cross-level interactions of contextual variables with x1 explain level variability in the slope coefficient This can be seen by re-arranging