Download

1 / 21
210 likes | 391 Views
REM 621 TOPIC 7: REVEALED PREFERENCE VALUATION TECHNIQUES. Revealed Preference: Hedonic Pricing Method (HPM). Derives values from the influence of environmental quality on market prices, especially property values

E N D
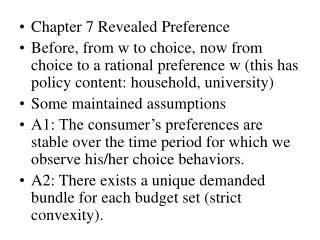
Revealed Preference: Hedonic Pricing Method (HPM) • Derives values from the influence of environmental quality on market prices, especially property values • Cross-sectional data on house prices and data on factors liable to influence these prices, including environmental quality (noise, air pollution, etc.) are needed • Multiple regression uses these factors to 'explain' the prices, and a measure of the impact of environmental quality can be derived.
Applying the Hedonic Pricing Method An HPM model looks as follows (PP is property price): PP = f (property variables, neighbourhood variables, accessibility variables, environmental variables) and might be specified as: lnPP = alnPROP + blnNHOOD +clnACCESS + dlnENV • a rough measure of value uses the derivative dPP/dENV • demand curve can be estimated from this & other data
Revealed Preference: Travel Cost Method (TCM) • Measures how much individuals are willing to pay to visit a site, given income, distance and competing sites • Adjusting for income differences and competing sites, the relationship between distance (and therefore costs) and number of visits is estimated per visitor (V): V = f (travel cost, income, substitutes, demographics) • Site visit price is increased arbitrarily (from zero) and visits per individual are recalculated and aggregated • This provides a demand curve for visits to the site
Applying the Travel Cost Method (TCM) Some of the problems associated with the TCM include: • treatment of time (does it have a cost? what is it?) • multi-site trips (how to allocate trip costs?) • use of estimated rather than real costs (accurate?) • treatment of discretionary costs (e.g. lodging) • allocating durables' costs on per trip basis • endogenous distance effects (residence selection?)
Production Function Approaches to Valuation • Production functions model the contribution of various inputs to outputs in a production process • Environment may be one of these inputs, as in: Q (output) = f(K (capital), L (labour), E (environment) • Production function techniques allow the analyst to isolate and value the contribution to output from the environment • For example, a coastal mangrove area may support commercial fish reproduction
Producers Surplus in the Black Sea Anchovy Fishery for the Pre-Mnemiopsis and Mnemiopsis Periods (US $’000, 1990 prices) Source: Knowler and Barbier 2000
Ecosystem Goods & Services from Tropical Forests Source: adapted from Barbier (1991), Panayotou and Ashton (1992), Myers (1992) and Pearce and Warford (1993)
Fire related damage Loss to Indonesia Loss to other countries Total Timber 493.7 -- 493.7 Agriculture 470.4 -- 470.4 Other Direct Uses 705.0 -- 705.0 Indirect use values 1,077.1 -- 1,077.1 Biodiversity 30.0 -- 30.0 Fire-fighting 25.1 13.4 25.1 Carbon release -- 272.1 272.1 Sub-total 2,787.9 285.5 3,073.4 Fire related damages (1997 $US Millions)
Haze related damage Loss to Indonesia Loss to other countries Total Short-term health 924.0 16.8 940.8 Tourism 70.4 185.8 256.2 Other 17.6 181.5 199.1 Sub-total 1,012.0 384.1 1,396.1 Total damage 3,799.9 669.6 4,469.5 Percent of total 85% 15% 100% Haze related damages (1997 $US Millions)