Download
1 / 27
370 likes | 993 Views
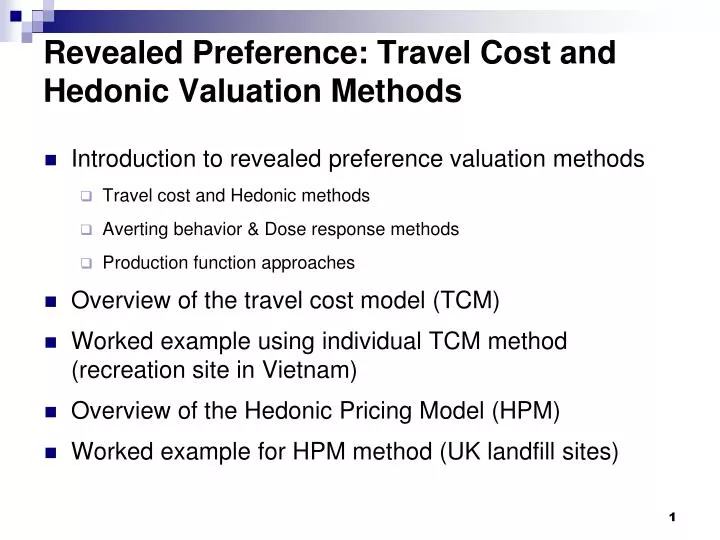
Revealed Preference: Travel Cost and Hedonic Valuation Methods. Introduction to revealed preference valuation methods Travel cost and Hedonic methods Averting behavior & Dose response methods Production function approaches Overview of the travel cost model (TCM)

E N D
Revealed Preference: Travel Cost and Hedonic Valuation Methods • Introduction to revealed preference valuation methods • Travel cost and Hedonic methods • Averting behavior & Dose response methods • Production function approaches • Overview of the travel cost model (TCM) • Worked example using individual TCM method (recreation site in Vietnam) • Overview of the Hedonic Pricing Model (HPM) • Worked example for HPM method (UK landfill sites)
Revealed preference methods • RP methods are based on observations of individual choices related to ecosystem services • Appropriate for direct and indirect use goods • Steps • Determine surrogate market for ecosystem service • Select appropriate RP method • Collect market data to estimate demand function • Infer value of change from demand function • Aggregate values • Discount values where appropriate
Revealed preference: limitations Market imperfections and policy failures Large, good quality data sets required Expensive and time consuming Omits non-use values Sensitive to assumptions about the relationship between ecosystem service and surrogate market
Revealed Preference: Travel Cost Method (TCM) • Measures how much individuals are willing to pay to visit a site, given income, distance and competing sites • Mostly used to value recreation sites but can also be applied to other situations (e.g. cultural services, etc.) • Visitor surveys provide distance travelled to site • Values estimated from costs per mile or per hour travelling • Two approaches: • Zonal travel cost (Clawson and Knetsch 1966) • Individual travel cost model (Brown and Nawas1973)
Individual Travel Cost Model Allows consideration of differing characteristics across travellers Adjusting for income differences and competing sites, the relationship between distance (and therefore costs) and number of visits is estimated per visitor (V): V = f (travel cost, income, substitutes, demographics) Site visit price is increased arbitrarily (from zero) and visits per individual are recalculated and aggregated This provides a demand curve for visits to the site
Problems with the TCM approach Can capture direct use values only Treatment of time (does it have a cost? What is it?) Multi-site trips (how to allocate trip costs?) Use of estimated rather than real costs (accurate?) Treatment of discretionary costs (e.G. Lodging) Allocating durables' costs on per trip basis Endogenous distance effects (residence selection?)
Travel cost method example: Vietnam • Nam and Son (2001) • Recreational value of the Hon Mun Islands, Vietnam • Marine Protected Area established in 2001 with US$2m funding over 4 years • Proposal to expand port at NhaTrang City with impacts on water quality and marine ecosystems Source: Google Maps
Travel cost method example: background • In 2000 there were 397,000 domestic and 118,700 foreign visitors • Both domestic and foreign visitors to the Hon MunIslands were surveyed • Origin of foreign visitors in survey sample: • Asia & Oceania – 115 respondents (54.7%) • Europe – 77 respondents (36.6%) • North America – 18 respondents (8.7%) • Average number of visits by domestic tourists was 1.7 visits per year (… issue?)
Travel Cost Regression Estimates for Two Functional Forms ** Statistically significant at 5% *** Statistically significant at 1%
Valuation results for Hon Mun Islands study Semi-log form was used to estimate consumer surplus per visit (1US$ = 14,500VND) Annual consumer surplus per visitor was VND 699,103 Consumer surplus per visit was VND 422,277 Recreational benefit per visit is the consumer surplus per visit plus the average travel cost per visit and was VND 651,661 Based on total number of visits to the islands of 194,810 in the year 2000, the total recreational benefit is estimated to be VND 126.948 billion per year.
Revealed Preference: Hedonic Pricing (HPM) • Assumes value of a good is a function of its characteristics, e.g. house prices (or rents) are determined by a number of attributes: • Structural: number of rooms, garden size, garage size, central heating, double glazing… • Socio-economic: quality of schools, unemployment rate, local taxes… • Local amenities: access to services, transport links, environmental quality… • Cross-sectional data on house prices and these other factors are needed, together with regression analysis • Analysis uses the data to 'explain' the house prices and a value of environmental quality can be obtained
Applying the Hedonic Pricing Method An HPM model looks as follows (PP is property price): PP = f (property variables, neighbourhood variables, accessibility variables, environmental variables) and might be specified as: lnPP = alnPROP + blnNHOOD +clnACCESS + dlnENV Rough measure of value uses the derivative ∂PP/∂ENV But not a proper welfare measure (WTP) except under strict assumptions Key requirement is that the housing market is in equilibrium (Is this likely??) Demand curve can be estimated from this & other data
Issues with the Hedonic Method Large amounts of data required and issues with type of data, e.g. sales vs. assessed values Omitted variable bias occurs if important explanatory variables missing from data, e.g. crime statistics Housing markets often segmented so several models may be needed Variables may be correlated, e.g. school quality and crime Can only be applied to environmental quality attributes that influence property prices
Hedonic Pricing: example • UK Defra study on effects of proximity to landfill sites on house prices [http://archive.defra.gov.uk/environment/waste/strategy/legislation/landfill/documents/landfill_disamenity.pdf] • Types of disamenity from landfill: noise, dust, litter, odour, vermin, visual intrusion, perception of risk • Housing variables used: • bedrooms & bathrooms • type of house (8 classes) and age (5 classes) • car parking space: single or double garage • partial central heating or full central heating • floor area
Hedonic Pricing: example • Used a GIS database of 592,000 mortgage transactions for 1990 to 2000 containing data on: • house prices • house characteristics • location • Also, data for 11,300 landfill sites, of which 6100 were operational • Models estimated separately for counties (sub-regions) to account for differences in local property markets • Hedonic model captured 80% of the variation in house prices; variables had “right” signs
Change in property values at different distances from landfill sites across UK regions (% change)
Hedonic Pricing example: overall results Average reduction in house prices of £5,500 within 0.25 miles of landfill and £1,600 between 0.25 and 0.5 miles Average total UK disamenity = £2,483m Between £334,350 and £478,990 per landfill site Between £1.52 and £2.18 per tonne of waste
How can these results be used? • Inform landfill tax levels - initially £15/tonne for active waste • Inform planning decisions • Feed into CBA on landfill siting decisions • mitigation actions • financial costs of alternative sites • Potential for compensation? • Some evidence of reduction in dis-amenity effects over time
Discussion questions Imagine a village where women collect fuelwood from a distant forest. How could you apply the TCM method to value an afforestation project nearer the village? Imagine a high-paying but hazardous job site where work conditions are improved via an environmental improvement. How could you apply the HPM method to value this improvement?
Revealed preference: Averting behaviour Averting behavior infers values from defensive, mitigating, or averting expenditures that prevent or counteract effects of environmental degradation For example, an individual might purchase a water filter to avoid the health risks associated with unfiltered water By analyzing the expenditures associated with these defensive purchases, researchers impute a value to small changes in damage risks Requires understanding of the technical relationship between environmental service and market good substitute Not as useful for valuing ecosystem services since focus is more on health risks (e.g. water quality)
Conditions for averting expenditures to produce true welfare measure: Too good to be true? AE must not be a “joint product”; that is, must not generate other benefits as well AE must be a perfect “substitute” for the change in environmental quality Change in AE must be entirely due to the change in environmental quality (vs. fence?) None of the inputs producing the environmental benefit (e.g. groundwater, well equipment) can be directly valued for themselves AE must not produce a “durable” benefit outlasting the pollution problem itself
Dose Response Valuation Method • Usually used to value damages from pollution • Relies on estimation of an emissions damage function • Steps in the process of estimating this function: • measure emissions • determine the resulting ambient environmental quality • estimate human exposure • measure impacts (health, aesthetic, recreation, etc.) • estimate the values of these impacts • Steps 1 & 2 involve the use of diffusion models and are primarily the concern of physical scientists • Linking steps 3 & 4 involves the dose-response function • Step 5 is where economists and valuation tools are used
Dose Response method: example • Pingaliet al. (1994) used the dose-response approach to value incremental health costs of pesticide use amongst rice farmers in the Philippines • The incremental health cost to the average sprayer was: • 1300 pesos per year (US $52) for 4 sprays/year, and • 2070 pesos (US $83) for 8 sprays/year • The results hinge on individual characteristics and vary according to age, smoking and drinking habits and the weight-to-height ratio
Estimated Dose Response Function (Pingaliet al. 1994) • The equation estimated by Pingaliet al was: ln (health cost) = 4.366 + 1.192 x ln(age) - 0.0756 x (ratio of weight to height) + 0.916 x (smoking dummy) - 0.53 x (drinking dummy) + 0.486 x ln(insecticide dose) - 0.042 x ln(herbicide dose) • R2 = 0.30, Degrees of freedom = 100